-
General
-
Releases
-
Owl Cloud Services
-
Base connector
-
- Beginner's Guide
- SAWSConnector settings
- Overview
- Station Overview
- Station configuration
- Datamaps
- Importing templates
- Format plugins explained
- Chaining format plugins
- Setting conditions
- Placeholders in format plugins
- Notes for field settings
- Jobs
- Testing exports and the development editor
- Job related tasks
- Job filter function
- How to create backups
- Running and Monitoring Jobs
- Start jobs automatically
- Import/Export & copy of data map rows
- Synchronizing references that are not contained in views
- Get the preconfigured "Source data set - Template"
- Configuring categories and products
- Fill Bundle and Variant tables from children
- Create View tree automatically
- Configuring the price & stock modules
- Configuring the price/stock value ranges
- Configuring volume discounts/scale prices
- How to export prices
- How to export stock values from certain storage units
- Use of Contentserv Credentials
- Show all articles ( 16 ) Collapse Articles
-
- Working with placeholder in conditions
- Improve usability of SC::Tables
- Placeholder for SC::Price, SC::Channel, SC::Stock
- REST Service API for SAWS Tables (Prices, Stock, Channels & Complex Articles)
- Dataflow import of SC::Tables
- Dataflow export of SC::Tables
- The datamap summary - Creating an automated documentation
- Export images as a ZIP file
- Image export with direct access to the CONTENTSERV platform
- Image export with no access to the CONTENTSERV platform
- Image export from a third party system
- How to configure CS Dashboard
- Setup a transformation list for CSTypes
- FAQ
- Transfer final result files to remote server by using FTP, sFTP, WebDAV or AzurBlobStorage
- Export Smart Document via Active Script and assign output to product
- Format Macros
- Show all articles ( 2 ) Collapse Articles
-
-
- Send value of a PIM reference
- Loop values for CS PIM references
- Send value of a MAM reference
- Loop values for CS MAM references
- Send value of a Channel (view) reference
- Loop values for CS Channel (Views) references
- Send value of an attribute reference
- Send value of a user reference
- Loop values for user references
- Send value of a reference (deprecated)
- Merge reference values
-
- Loops explained
- Loop values for several attributes simultaneously
- Loop values for child elements
- Loop values for CS PIM references
- Loop values for CS Channel (Views) references
- Loop values for CS MAM references
- Loop values for user references
- Loop values for SC::Prices
- Loop values for SC::Stocktable entries
- Loop values for SC::Complex products
- Loop values for CS type reference
- Loop values for a CS table
- Loop value for simple data record
-
- Create a JSON-String (create an array)
- Export several values simultaneously
- Format value lists
- Execute a conditional format (switch-case)
- Tree paths or values from tree elements
- Export value of current attribute
- Multistep formatting
- Send accesslevel of the object
- Send value of a job parameter
- Search for values in several attributes
- Format with PHP Code (deprecated)
- Format Macros
-
GenericJSON Connector
-
-
- Send value of a PIM reference
- Loop values for CS PIM references
- Send value of a Channel (view) reference
- Loop values for CS Channel (Views) references
- Send value of a MAM reference
- Loop values for CS MAM references
- Send value of an attribute reference
- Send value of a user reference
- Loop values for user references
- Send value of a reference (deprecated)
- Merge reference values
-
- Loops explained
- Loop values for several attributes simultaneously
- Loop values for child elements
- Loop values for CS PIM references
- Loop values for CS Channel (Views) references
- Loop values for CS MAM references
- Loop values for user references
- Loop values for SC::Prices
- Loop values for SC::Stocktable entries
- Loop values for SC::Complex products
- Loop values for a CS table
- Loop values for CS type reference
- Loop value for simple data record
-
- Create a JSON-String (create an array)
- Export several values simultaneously
- Format value lists
- Execute a conditional format (switch-case)
- Tree paths or values from tree elements
- Export value of current attribute
- Multistep formatting
- Send accesslevel of the object
- Send value of a job parameter
- Search for values in several attributes
- Format with PHP Code (deprecated)
- Format Macros
-
GenericXML Connector
-
- All Tutorials for creating XMLs
- SAWSConnector settings
- Station configuration
- Example station configuration
- Source data set configuration
- Example source data set mappings for the XML export
- Job configuration
- Simple XML Tags
- Images
- References
- SC::Prices
- SC::Stock
- SC::Channel
- Specials
- BMECat 1.2 Template
-
-
- Send value of a PIM reference
- Loop values for CS PIM references
- Send value of a Channel (view) reference
- Loop values for CS Channel (Views) references
- Send value of a MAM reference
- Loop values for CS MAM references
- Send value of an attribute reference
- Send value of a user reference
- Loop values for user references
- Send value of a reference (deprecated)
- Merge reference values
-
- Loops explained
- Loop values for several attributes simultaneously
- Loop values for child elements
- Loop values for CS PIM references
- Loop values for CS Channel (Views) references
- Loop values for CS MAM references
- Loop values for user references
- Loop values for SC::Prices
- Loop values for SC::Stocktable entries
- Loop values for SC::Complex products
- Loop values for a CS table
- Loop values for CS type reference
- Loop value for simple data record
-
- Create a JSON-String (create an array)
- Export several values simultaneously
- Format value lists
- Execute a conditional format (switch-case)
- Tree paths or values from tree elements
- Export value of current attribute
- Multistep formatting
- Send accesslevel of the object
- Send value of a job parameter
- Search for values in several attributes
- Format with PHP Code (deprecated)
- Format Macros
-
SimpleExcel Connector
-
-
- Send value of a PIM reference
- Loop values for CS PIM references
- Send value of a Channel (view) reference
- Loop values for CS Channel (Views) references
- Send value of a MAM reference
- Loop values for CS MAM references
- Send value of an attribute reference
- Send value of a user reference
- Loop values for user references
- Send value of a reference (deprecated)
- Merge reference values
-
- Loops explained
- Loop values for several attributes simultaneously
- Loop values for child elements
- Loop values for CS PIM references
- Loop values for CS Channel (Views) references
- Loop values for CS MAM references
- Loop values for user references
- Loop values for SC::Prices
- Loop values for SC::Stocktable entries
- Loop values for SC::Complex products
- Loop values for a CS table
- Loop values for CS type reference
- Loop value for simple data record
-
- Create a JSON-String (create an array)
- Export several values simultaneously
- Format value lists
- Execute a conditional format (switch-case)
- Tree paths or values from tree elements
- Export value of current attribute
- Multistep formatting
- Send accesslevel of the object
- Send value of a job parameter
- Search for values in several attributes
- Format with PHP Code (deprecated)
- Format Macros
-
Magento Connector
-
- Magento 2.x configuration
- Creating views
- Configuring categories and products
- Stations
- Add and configure a new source data set
- Assigning a Magento website
- Advanced pricing export
- Configurable products
- Bundle products
- country_of_manufacture
- max_sale_qty
- meta_description
- meta_keyword
- min_sale_qty
- msrp
- msrp_display_actual_price_type
- msrp_enabled
- news_from_date
- news_to_date
- special_from_date
- special_price
- special_to_date
- _links_crosssell_sku
- _links_related_sku
- _links_upsell_sku
- _media_image
- available_sort_by
- default_sort_by
- image
- include_in_menu
- is_active
- is_anchor
- is_in_stock
- meta_title
- name
- price
- small_image
- status
- tax_class_id
- thumbnail
- visibility
- weight
- description
- qty
- short_description
- sku
- Adding Jobs
- Show all articles ( 32 ) Collapse Articles
-
-
- Send value of a PIM reference
- Loop values for CS PIM references
- Send value of a Channel (view) reference
- Loop values for CS Channel (Views) references
- Send value of a MAM reference
- Loop values for CS MAM references
- Send value of an attribute reference
- Send value of a user reference
- Loop values for user references
- Send value of a reference (deprecated)
- Merge reference values
-
- Loops explained
- Loop values for several attributes simultaneously
- Loop values for child elements
- Loop values for CS PIM references
- Loop values for CS Channel (Views) references
- Loop values for CS MAM references
- Loop values for user references
- Loop values for SC::Prices
- Loop values for SC::Stocktable entries
- Loop values for SC::Complex products
- Loop values for a CS table
- Loop values for CS type reference
- Loop value for simple data record
-
- Create a JSON-String (create an array)
- Export several values simultaneously
- Format value lists
- Execute a conditional format (switch-case)
- Tree paths or values from tree elements
- Export value of current attribute
- Multistep formatting
- Send accesslevel of the object
- Send value of a job parameter
- Search for values in several attributes
- Format with PHP Code (deprecated)
- Format Macros
-
Shopware 5 Connector
-
- Configuration Shopware
- Configuration PIM
- Shopware attribute setting
- Configuration SAWSConnector
- Station configuration
- Source data set configuration
- Configuring categories and products
- Price table configuration for Shopware
- Result in Shopware
- Subshops and the SAWSConnector Shopware
- ean
- Custom Fields (attribute)
- highlight
- purchaseSteps
- stockMin
- supplierNumber
- notification
- shippingFree
- length
- height
- width
- weight
- shippingTime
- metaKeywords
- added
- blog
- descriptionLong
- hidefilter
- hideTop
- inStock
- keywords
- lastStock
- maxPurchase
- metaDescription
- minPurchase
- noViewSelect
- pseudoSales
- related
- releaseDate
- showFilterGroups
- similar
- tax
- template
- cmsHeadline
- cmsText
- description
- metaTitle
- name
- number
- supplier
- Show all articles ( 35 ) Collapse Articles
-
-
- Send value of a PIM reference
- Loop values for CS PIM references
- Send value of a Channel (view) reference
- Loop values for CS Channel (Views) references
- Send value of a MAM reference
- Loop values for CS MAM references
- Send value of an attribute reference
- Send value of a user reference
- Loop values for user references
- Send value of a reference (deprecated)
- Merge reference values
-
- Loops explained
- Loop values for several attributes simultaneously
- Loop values for child elements
- Loop values for CS PIM references
- Loop values for CS Channel (Views) references
- Loop values for CS MAM references
- Loop values for user references
- Loop values for SC::Prices
- Loop values for SC::Stocktable entries
- Loop values for SC::Complex products
- Loop values for a CS table
- Loop values for CS type reference
- Loop value for simple data record
-
- Create a JSON-String (create an array)
- Export several values simultaneously
- Format value lists
- Execute a conditional format (switch-case)
- Tree paths or values from tree elements
- Export value of current attribute
- Multistep formatting
- Send accesslevel of the object
- Send value of a job parameter
- Search for values in several attributes
- Format with PHP Code (deprecated)
- Format Macros
-
Shopware 6 Connector
-
- Tutorial Video
- First steps
- Import Shopware settings
- Export categories
- Export media files
- Export simple products
- Export multiple languages
- Export variant products
- Export product properties
- Export custom fields
- Export product cross-selling relationships
- Export prices
- Export stocks
- Export into any other Shopware field
- How to address multiple Shopware 6 websites
- How to address different Shopware 6 Sale-Channels from one Contentserv System
- Useful Links
- Export via RabbitMQ
- Show all articles ( 3 ) Collapse Articles
-
-
- Send value of a PIM reference
- Loop values for CS PIM references
- Send value of a MAM reference
- Loop values for CS MAM references
- Send value of a Channel (view) reference
- Loop values for CS Channel (Views) references
- Send value of an attribute reference
- Send value of a user reference
- Loop values for user references
- Send value of a reference (deprecated)
- Merge reference values
-
- Loops explained
- Loop values for several attributes simultaneously
- Loop values for child elements
- Loop values for CS PIM references
- Loop values for CS Channel (Views) references
- Loop values for CS MAM references
- Loop values for user references
- Loop values for SC::Prices
- Loop values for SC::Stocktable entries
- Loop values for SC::Complex products
- Loop values for a CS table
- Loop values for CS type reference
- Loop value for simple data record
-
- Create a JSON-String (create an array)
- Export several values simultaneously
- Format value lists
- Execute a conditional format (switch-case)
- Tree paths or values from tree elements
- Export value of current attribute
- Multistep formatting
- Send accesslevel of the object
- Send value of a job parameter
- Search for values in several attributes
- Format with PHP Code (deprecated)
- Format Macros
-
OXID Connector
-
-
- Send value of a PIM reference
- Loop values for CS PIM references
- Send value of a MAM reference
- Loop values for CS MAM references
- Send value of a Channel (view) reference
- Loop values for CS Channel (Views) references
- Send value of an attribute reference
- Send value of a user reference
- Loop values for user references
- Send value of a reference (deprecated)
- Merge reference values
-
- Loops explained
- Loop values for several attributes simultaneously
- Loop values for child elements
- Loop values for CS PIM references
- Loop values for CS Channel (Views) references
- Loop values for CS MAM references
- Loop values for user references
- Loop values for SC::Prices
- Loop values for SC::Stocktable entries
- Loop values for SC::Complex products
- Loop values for a CS table
- Loop values for CS type reference
- Loop value for simple data record
-
- Create a JSON-String (create an array)
- Export several values simultaneously
- Format value lists
- Execute a conditional format (switch-case)
- Tree paths or values from tree elements
- Export value of current attribute
- Multistep formatting
- Send accesslevel of the object
- Send value of a job parameter
- Search for values in several attributes
- Format with PHP Code (deprecated)
- Format Macros
-
Typo3 Connector
-
-
- Send value of a PIM reference
- Loop values for CS PIM references
- Send value of a Channel (view) reference
- Loop values for CS Channel (Views) references
- Send value of a MAM reference
- Loop values for CS MAM references
- Send value of an attribute reference
- Send value of a user reference
- Loop values for user references
- Send value of a reference (deprecated)
- Merge reference values
-
- Loops explained
- Loop values for several attributes simultaneously
- Loop values for child elements
- Loop values for CS PIM references
- Loop values for CS Channel (Views) references
- Loop values for CS MAM references
- Loop values for user references
- Loop values for SC::Prices
- Loop values for SC::Stocktable entries
- Loop values for SC::Complex products
- Loop values for a CS table
- Loop values for CS type reference
- Loop value for simple data record
-
- Create a JSON-String (create an array)
- Export several values simultaneously
- Format value lists
- Execute a conditional format (switch-case)
- Tree paths or values from tree elements
- Export value of current attribute
- Multistep formatting
- Send accesslevel of the object
- Send value of a job parameter
- Search for values in several attributes
- Format with PHP Code (deprecated)
- Format Macros
-
WooCommerce Connector
-
-
- Send value of a PIM reference
- Loop values for CS PIM references
- Send value of a Channel (view) reference
- Loop values for CS Channel (Views) references
- Send value of a MAM reference
- Loop values for CS MAM references
- Send value of an attribute reference
- Send value of a user reference
- Loop values for user references
- Send value of a reference (deprecated)
- Merge reference values
-
- Loops explained
- Loop values for several attributes simultaneously
- Loop values for child elements
- Loop values for CS PIM references
- Loop values for CS Channel (Views) references
- Loop values for CS MAM references
- Loop values for user references
- Loop values for SC::Prices
- Loop values for SC::Stocktable entries
- Loop values for SC::Complex products
- Loop values for a CS table
- Loop values for CS type reference
- Loop value for simple data record
-
- Create a JSON-String (create an array)
- Export several values simultaneously
- Format value lists
- Execute a conditional format (switch-case)
- Tree paths or values from tree elements
- Export value of current attribute
- Multistep formatting
- Send accesslevel of the object
- Send value of a job parameter
- Search for values in several attributes
- Format with PHP Code (deprecated)
- Format Macros
-
Other connectors
Testing exports and the development editor
After configuring the first export pipeline consisting of:
- Station
- Datamap
- Job
we’re ready to test our “SAWS-Trinity”.
For testing we always recommend the developmennt-editor. You can open it in your job-editor.
While the development-editor quickly grants access to all needed configurations and information, it can only run jobs in a single process.
This results in significantly higher export times, which means this mode of running jobs is not suited for production use but, as the name suggests, is intendet for creating and testing configurations.
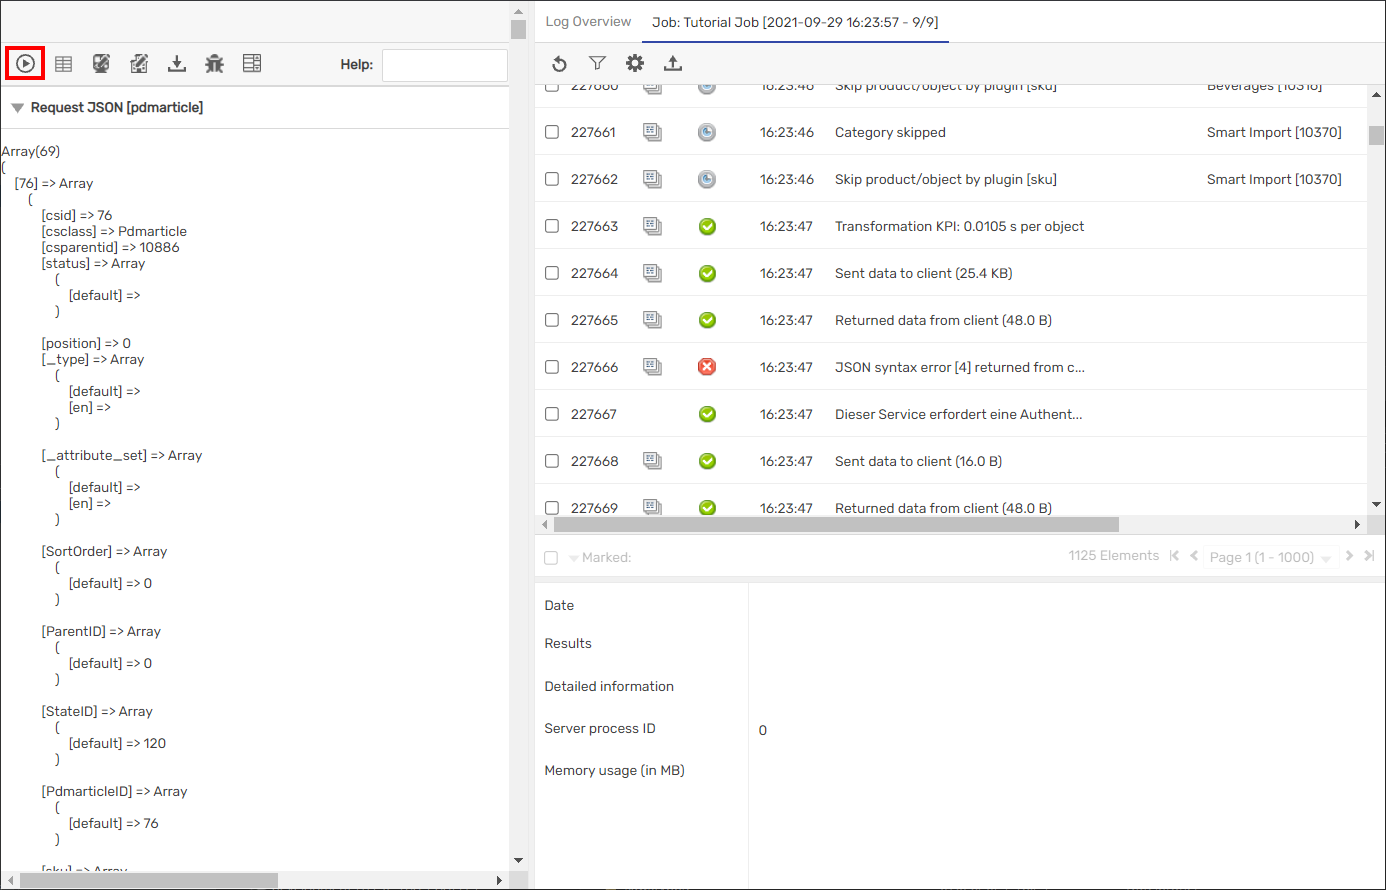
Opening the dev-editor will start the job.
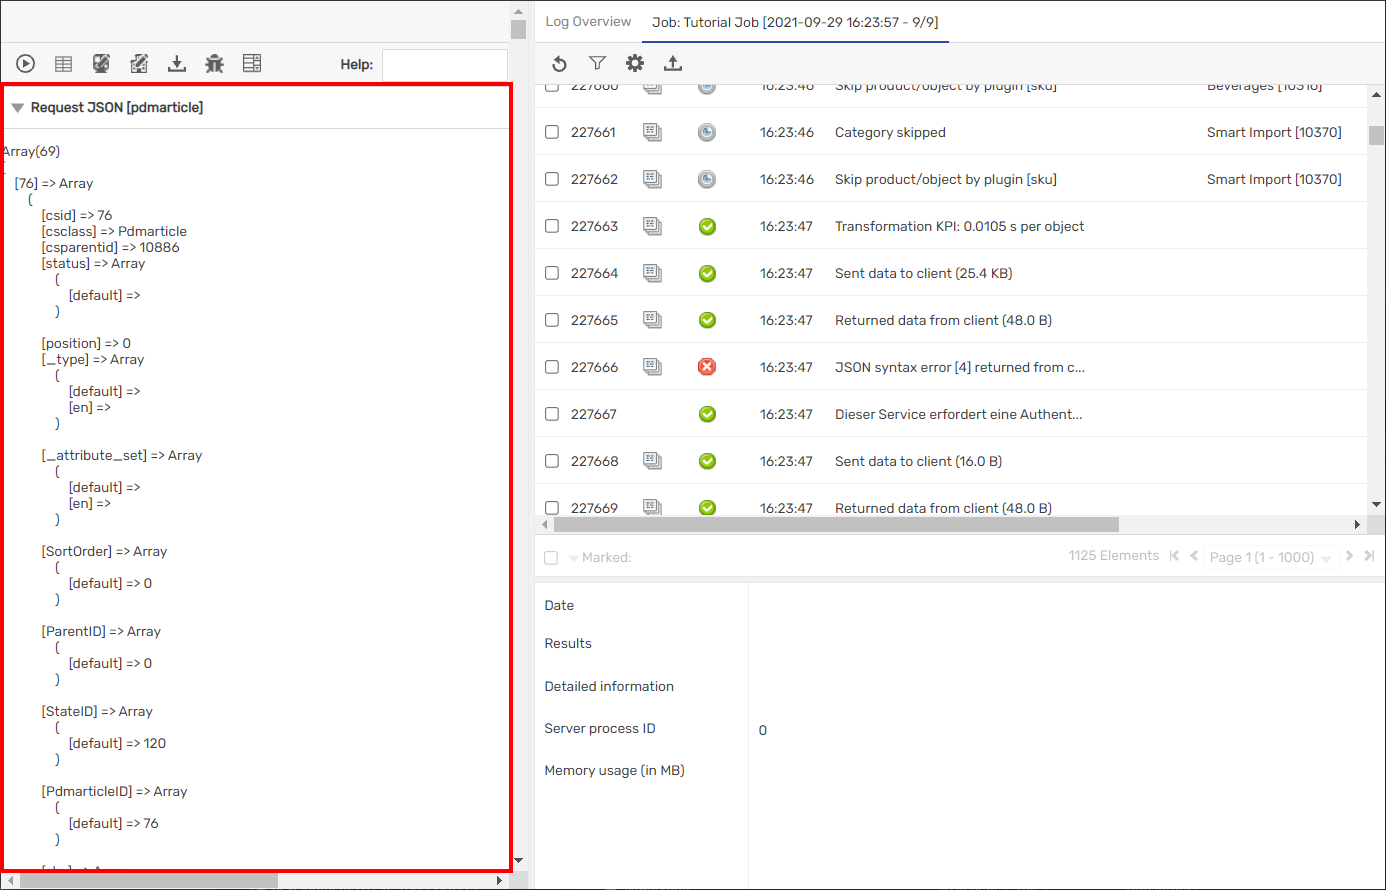
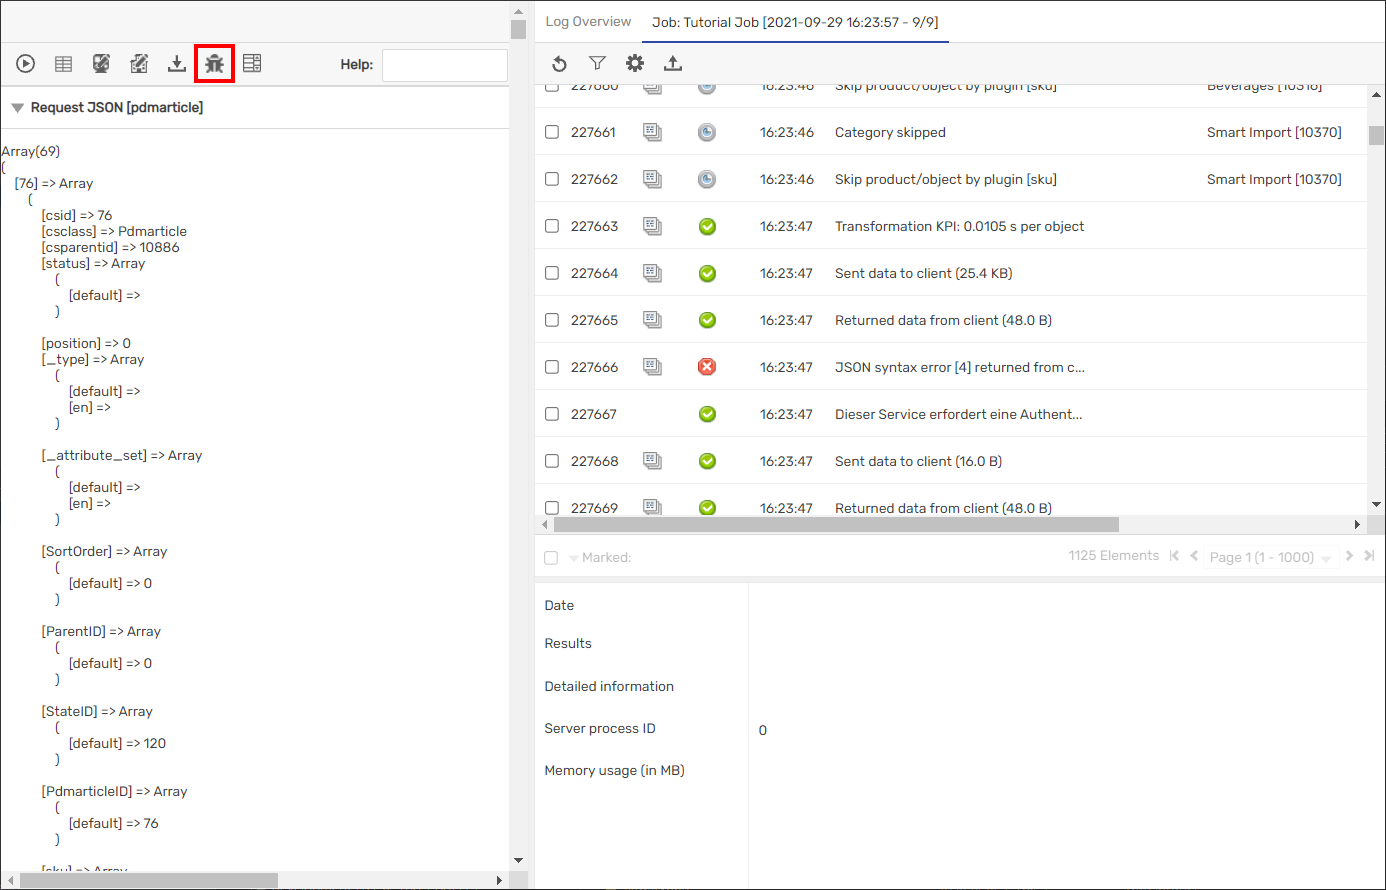
GUI Elements

Data Display
This pane displays the raw data that was created by this export.
You can use it to see how your changes influenced the exported data.
Log Display
Here you can see the log entries which were created by the job.
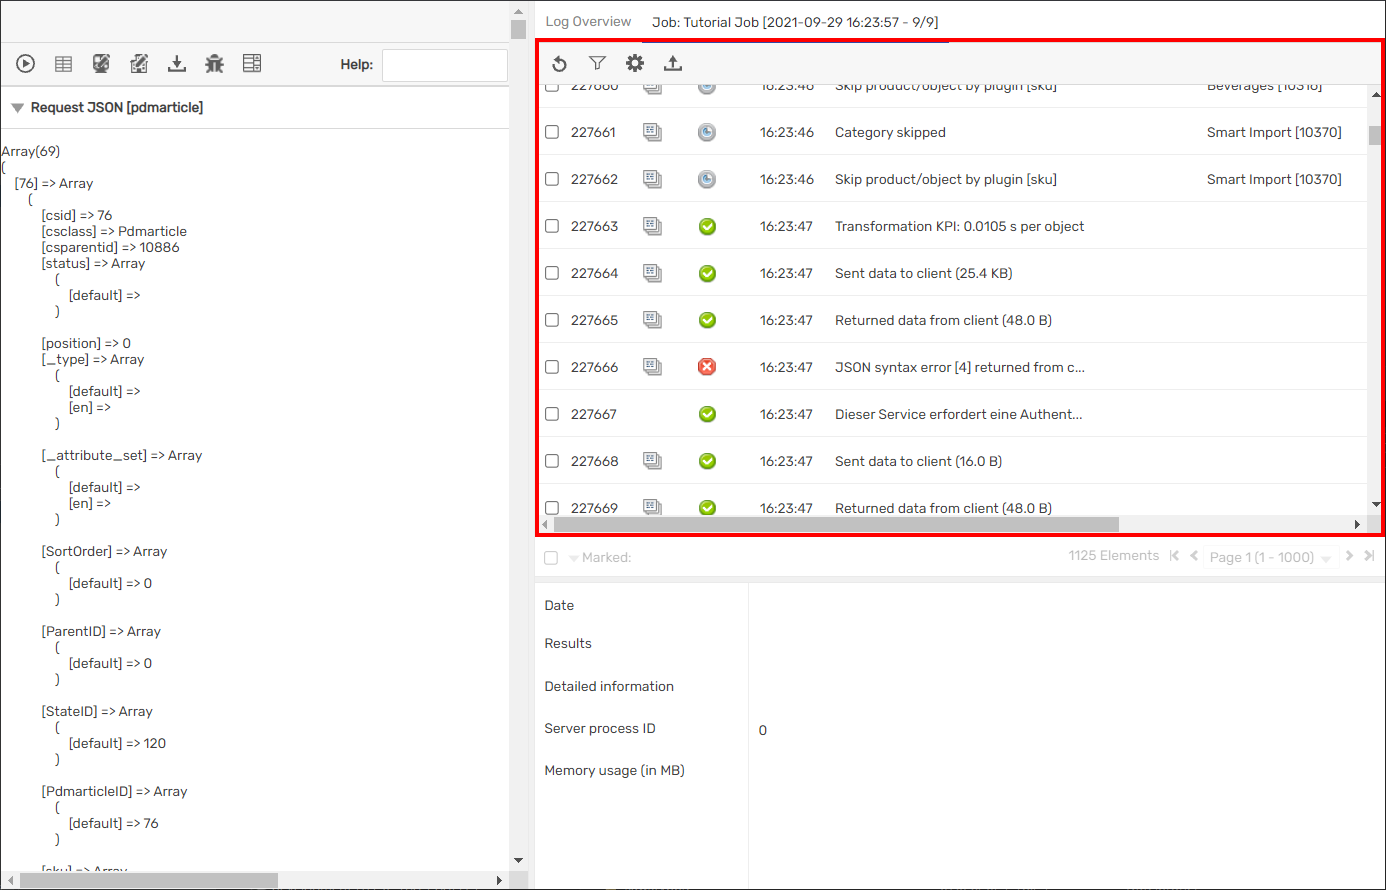
Success Log
This symbol marks a log as a success. The log entry contains additional information about the action performed.
![]()
Notice Log
This symbol marks the log entry as a notice which contains information about the export, but doesn’t neccesarily mean the export failed.
![]()
Error Log
This symbol marks log entries as an error. Errors may mean that the export did not complete or may simply warn you about possible configuration errors.
The amount of errors does not indicate the severity of the issue. Some errors may be pretty harmless, but are triggered for each exported value.
Please view error messages in detail before panicking or dismissing them.
![]()
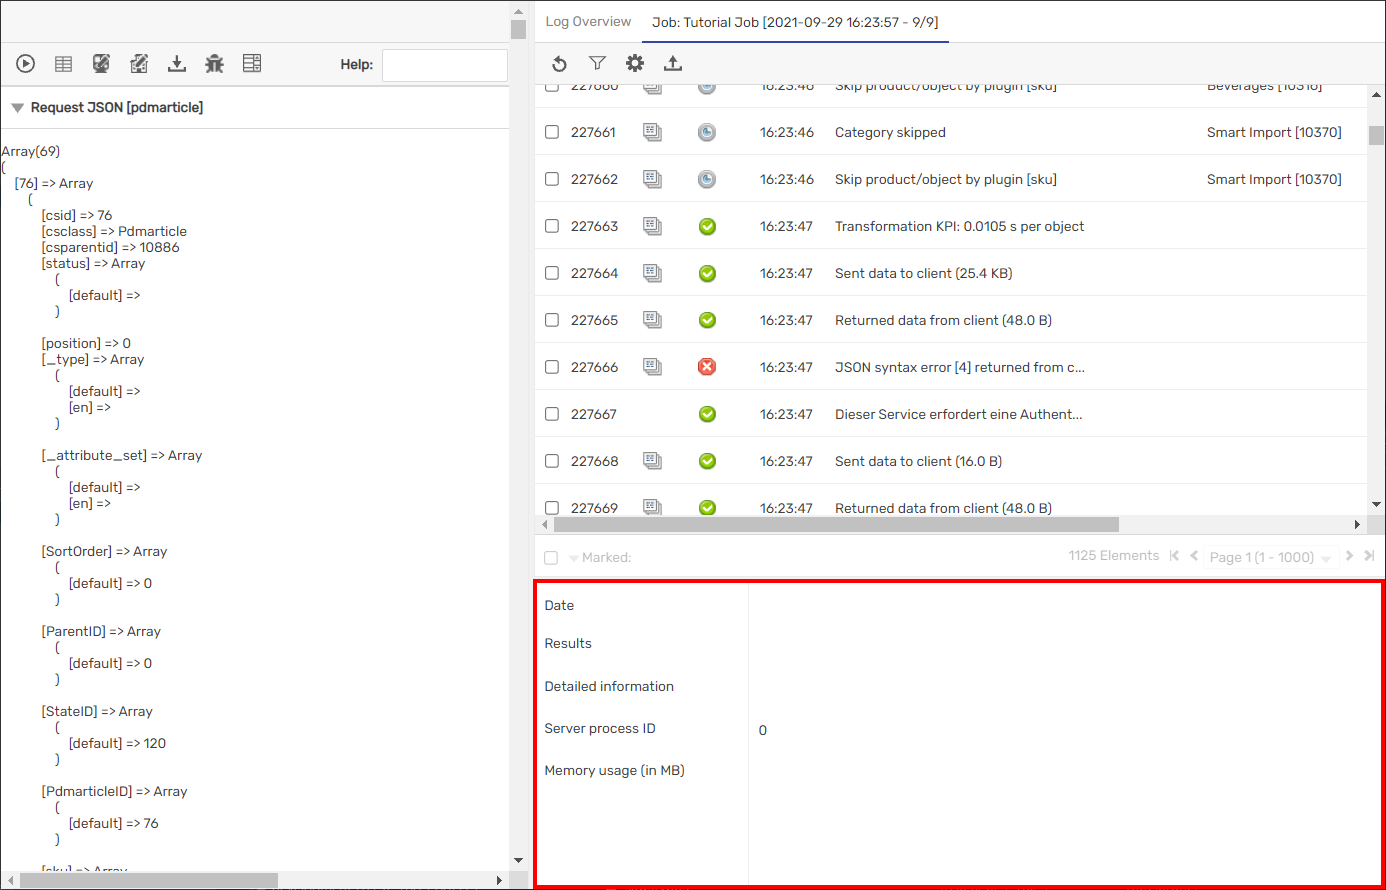
Details Display
Click a log entry in the log display to display additional details here.
This is especially important for error logs, which will contain additional info about what triggered the job and sometimes even provide a solution.
Quick Access Buttons
Restart Job
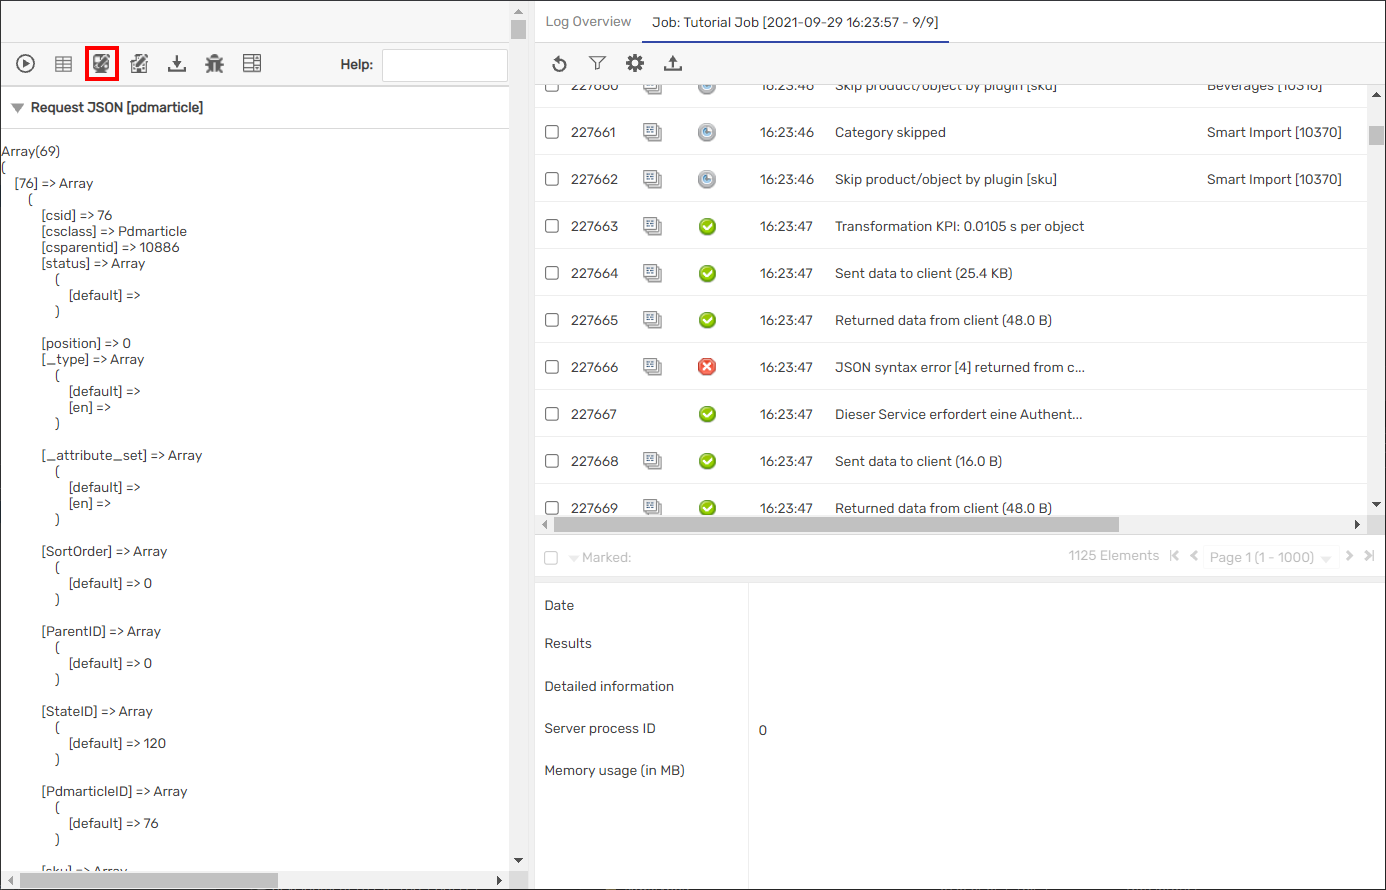
Datamap Editor

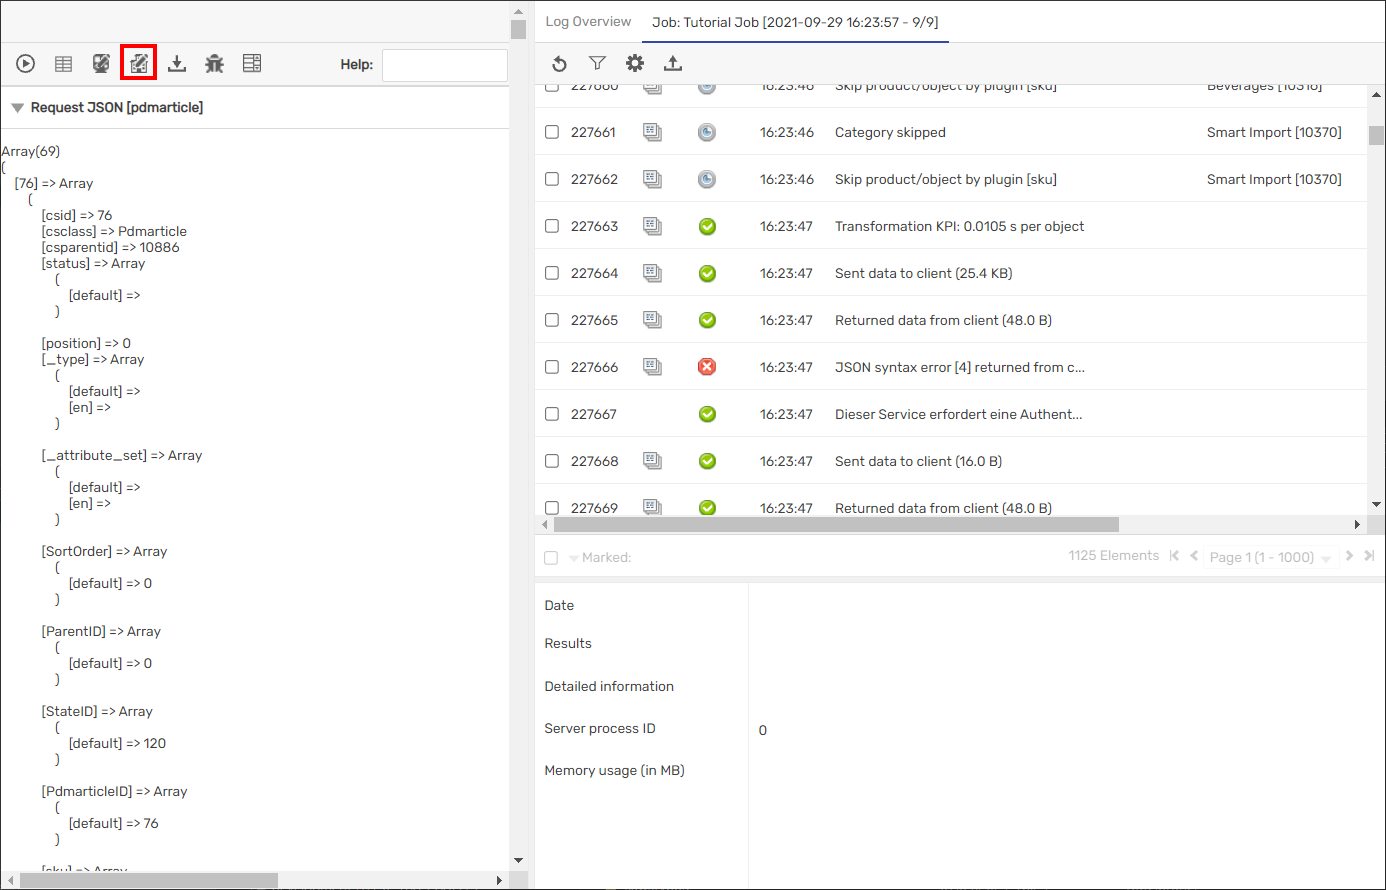
Job Editor
Station Editor
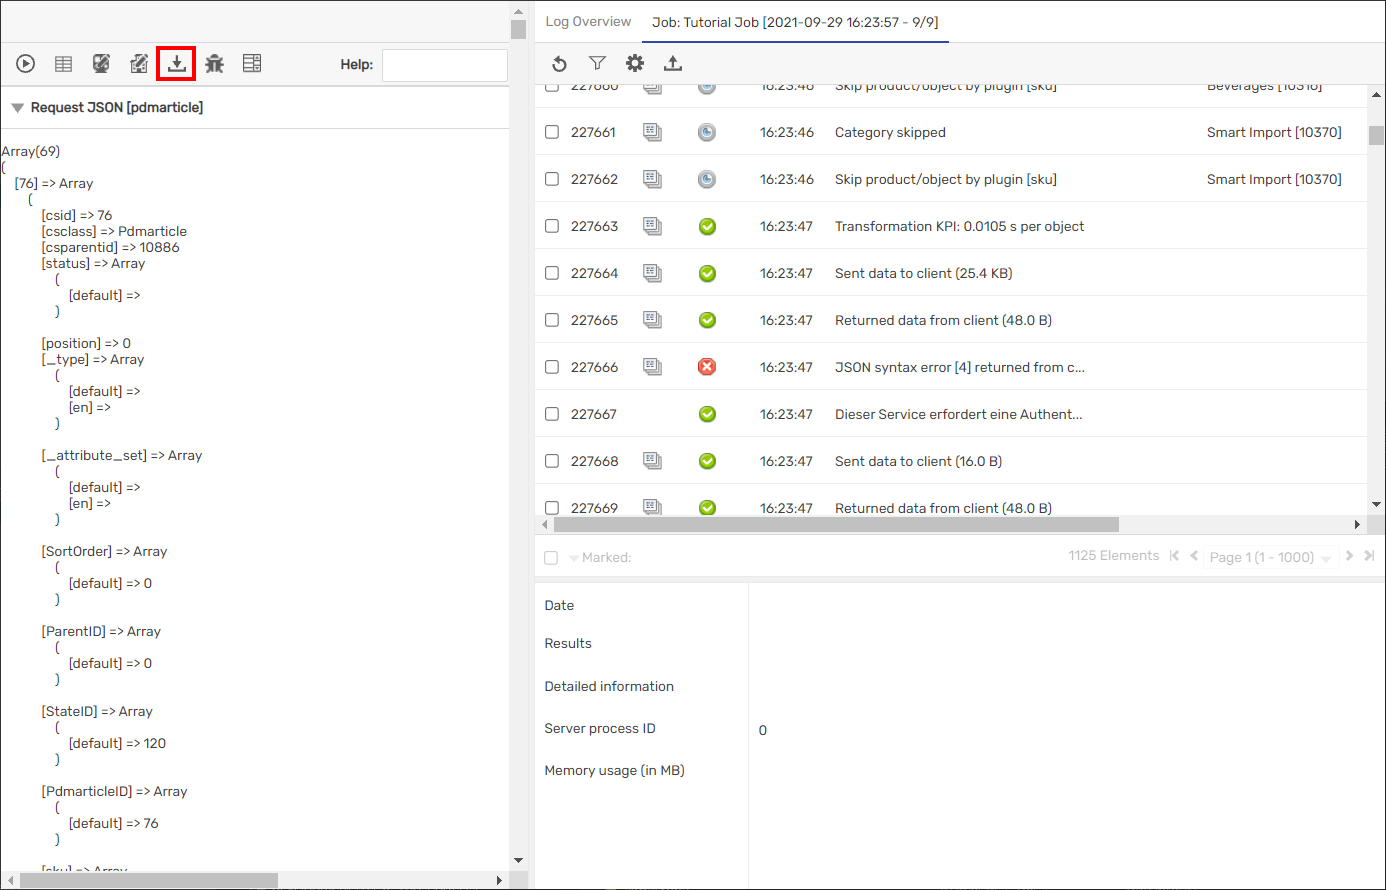
Download Validation File
This button will download a File which can either be used to view the export result locally or to setup an automatic validation when starting via an activescript.
Automatic Validation can be used to test the functionality after updates and ensure the connector is still working as intended.
Debugger
Use this button to open the SC::Debugger.
The Debugger allows you to view each formatting step to find errors in your configurations.
You will need Cloud access to use the Debugger.
The SC::Debugger will be covered in a seperate tutorial.
Edit Transformation Lists
![]()
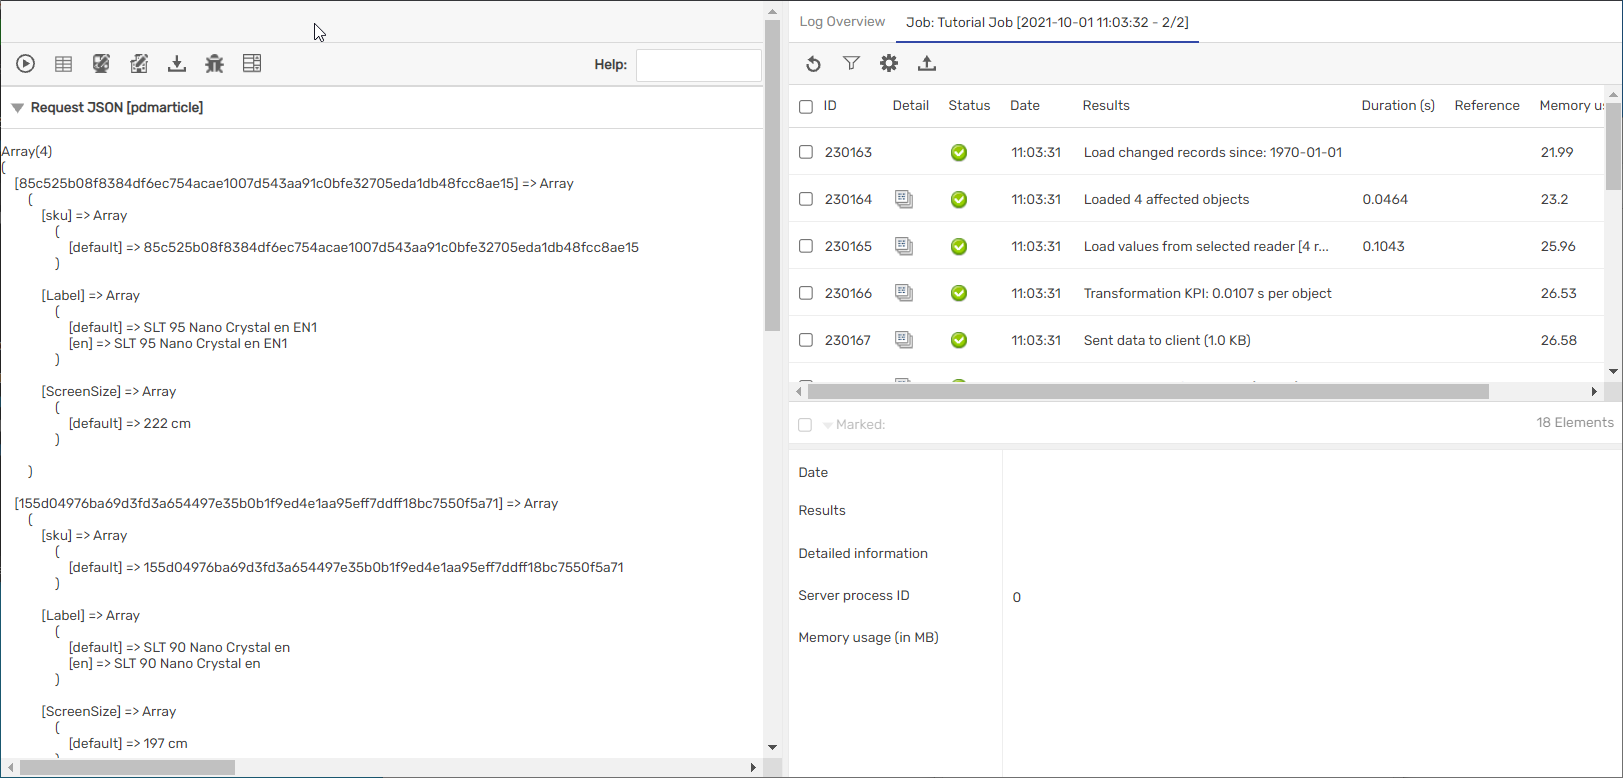
Example Export
This is a datamap configuration from the JSON Connector:
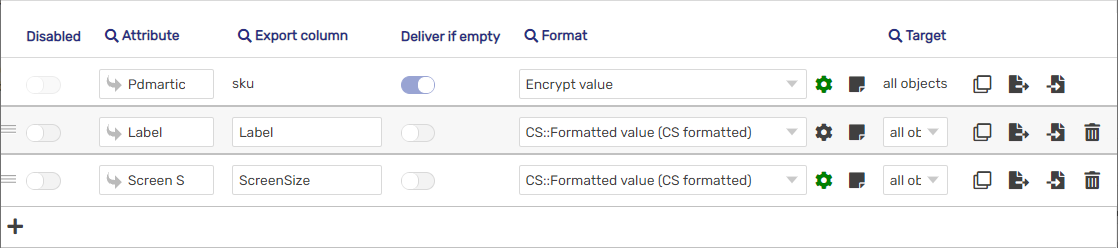
An Export using this configuration will net the following result:
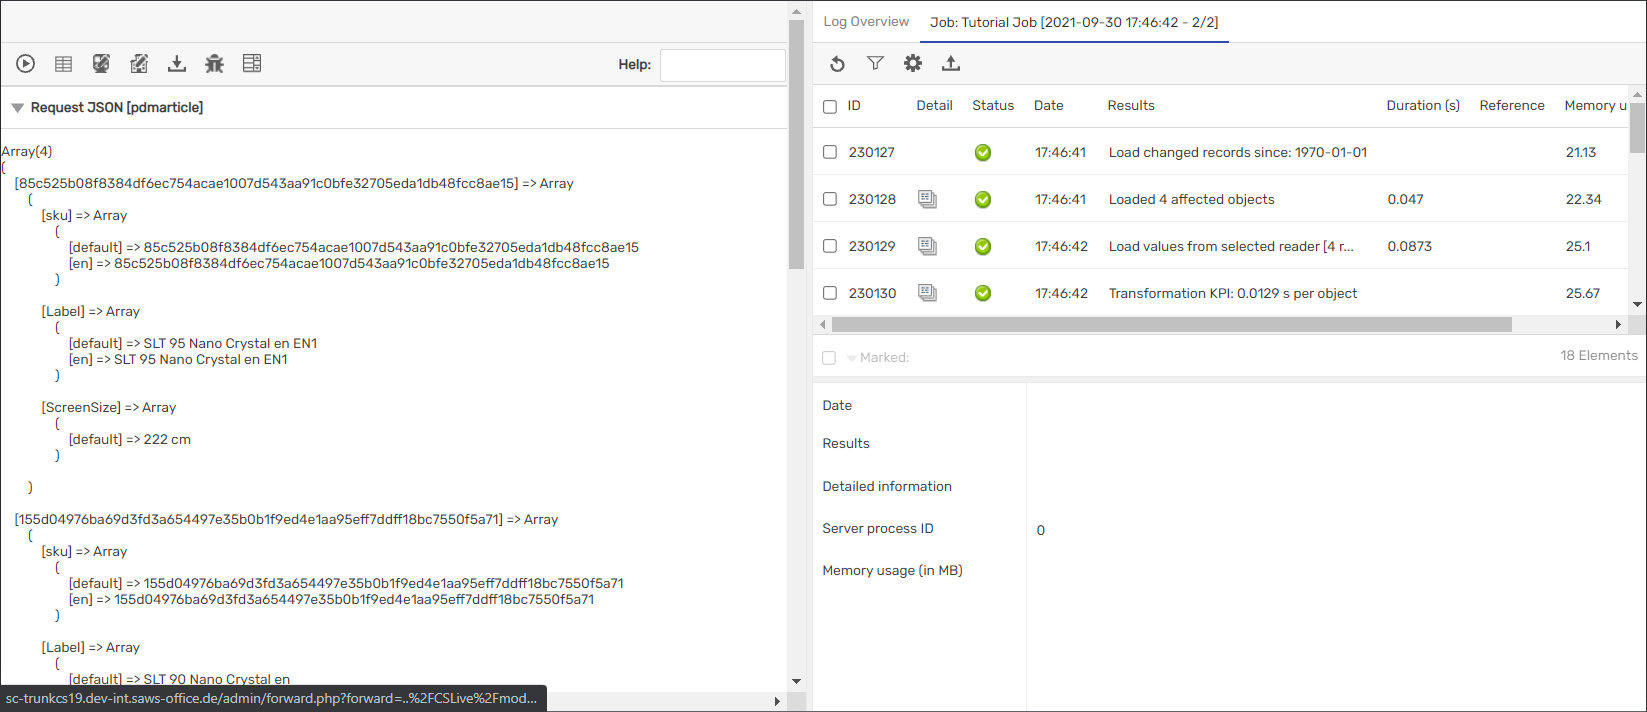
As you can see, the sku is still language dependant. As it is used to identify a product, it should be language independent.
To achieve this, we’ll open the datamap via the button at the top, enter the plugin configuration and change the language dependency.
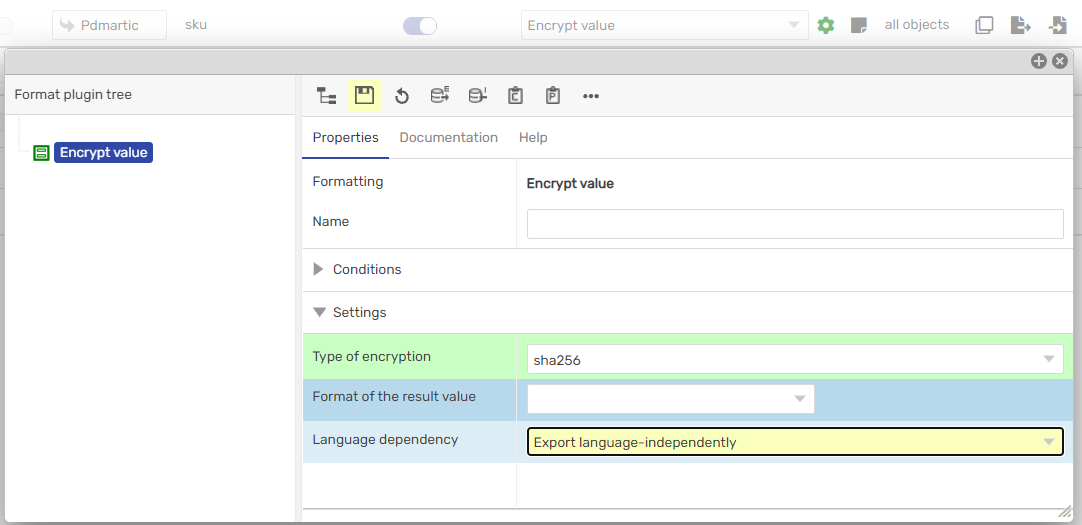
After saving we just have to restart the export via the corresponding button at the top.
The finished export should now show the sku language independently.