-
General
-
Releases
-
Base Connector
-
- Beginner's Guide
- Overview
- Stations
- Datamaps
- Importing templates
- Formats
- Setting conditions
- Placeholders
- Job filter function
- How to create backups
- Running and Monitoring Jobs
- Export Job Automation
- Import/Export & copy of data map rows
- Synchronizing references that are not contained in views
- Get the preconfigured "Source data set - Template"
- Configuring categories and products
- Channel/View Tree Maintenance Active Job
- Configuring the price & stock modules
- Configuring the price/stock value ranges
- Configuring volume discounts/scale prices
- How to export prices
- How to export stock values from certain storage units
- Use of Contentserv Credentials
- Connector & Station User Limitation
- SC::Dynamic Image Crop Preset
- Todos
- Show all articles ( 11 ) Collapse Articles
-
- Price Table
- Stock Table
- Sales Channel Table
- Complex Article Table
- Importing data into SAWS tables (price, stock, etc.)
- SAWSConnector Usages
- Variant Articles
- Assignment of articles to complex articles
- Searching for SC::Prices / SC::Stocks
- Searching for SC::Channels
- Setup a transformation list for CSTypes
- Context-Sensitive Product Value Export
-
- Working with placeholder in conditions
- Improve usability of SC::Tables
- Placeholder for SC::Price, SC::Channel, SC::Stock
- REST Service API for SAWS Tables (Prices, Stock, Channels & Complex Articles)
- Dataflow import of SC::Tables
- Dataflow export of SC::Tables
- The datamap summary - Creating an automated documentation
- Export images as a ZIP file
- Image export with direct access to the CONTENTSERV platform
- Image export with no access to the CONTENTSERV platform
- Image export from a third party system
- How to configure CS Dashboard
- Setup a transformation list for CSTypes
- FAQ
- Export Smart Document via Active Script and assign output to product
- Format Macros
- Controlling Connector Jobs via the REST API
- Sales Channel Maintenance via Excel Cross-Reference
- Sales Channel Inheritance Active Job
- Job Parameters & Context Parameters
- Logbook
- Fill complex article tables automatically
- Datamap Mapping Status
- Show all articles ( 8 ) Collapse Articles
-
-
- Send value of a PIM reference
- Loop values for CS PIM references
- Send value of a MAM reference
- Loop values for CS MAM references
- Send value of a Channel (view) reference
- Loop values for CS Channel (Views) references
- Send value of an attribute reference
- Send value of a user reference
- Loop values for user references
- Send value of a reference (deprecated)
- Merge reference values format plugin
- Search for usage of item
- Search for item IDs using attribute data
-
- Loop Head and Loop Value
- Loop values for several attributes simultaneously
- Loop values for child elements
- Loop values for CS PIM references
- Loop values for CS Channel (Views) references
- Loop values for CS MAM references
- Loop values for user references
- Loop values for SC::Prices
- Loop values for SC::Stocktable entries
- Loop values for SC::Complex products
- Loop values for CS type reference
- Loop values for a CS table
- Loop value for simple data record
- Loop values for JSON Objects
- Loop for value range entries
-
- Create a JSON-String (create an array)
- Format value lists
- Tree paths or values from tree elements
- Multistep formatting
- Send accesslevel of the object
- Send value of a job parameter
- Search for values in several attributes
- Format with PHP Code (deprecated)
- Format Macros
- Load data via REST Service
- AI Value Transformation Format
- AI Value Translation Format
- Store value into a Contentserv Item
- Execute a conditional format (switch-case) Format Plugin
- Load array value from the Contentserv getValues Format Plugin
- Process HTML table Format Plugin
- Replace via regex pattern format plugin
- Convert value ranges into each other
- Merge Array Format Plugin
- Export several attributes simultaneously
- Show all articles ( 5 ) Collapse Articles
-
Owl Cloud Services
-
Owl Data Hub
-
Ursula AI
- Ursula AI
- Supported AIs
- AI Value Transformation Format
- AI Value Translation Format
- Generate Descriptions with Ursula AI Active Job
- Populate Attributes via Ursula AI Active Job
- AI Product Tree Organizer Active Job
- Mapping Sales Channels via the Ursula AI Active Job
- Store value into a Contentserv Item
-
GenericJSON / DynamicJSON Connector
-
- SAWSConnector settings
- Categories
- Products
- Product-Category assignment
- Export von Feldkonfigurationen/Attribute/Wertelisten
- Finish the export
- Response log
- Sample JSONs
- SQL Transmitter
- Shopify Transmitter
- Base. (Baselinker) Transmitter
- PlentyONE Transmitter
- Building JSON Target Keys
- Default HTTP Transmitter
- Configuratorware Transmitter
-
-
- Send value of a PIM reference
- Loop values for CS PIM references
- Send value of a Channel (view) reference
- Loop values for CS Channel (Views) references
- Send value of a MAM reference
- Loop values for CS MAM references
- Send value of an attribute reference
- Send value of a user reference
- Loop values for user references
- Send value of a reference (deprecated)
- Merge reference values format plugin
- Search for usage of item
- Search for item IDs using attribute data
-
- Loop Head and Loop Value
- Loop values for several attributes simultaneously
- Loop values for child elements
- Loop values for CS PIM references
- Loop values for CS Channel (Views) references
- Loop values for CS MAM references
- Loop values for user references
- Loop values for SC::Prices
- Loop values for SC::Stocktable entries
- Loop values for SC::Complex products
- Loop values for a CS table
- Loop values for CS type reference
- Loop value for simple data record
- Loop values for JSON Objects
- Loop for value range entries
-
- Create a JSON-String (create an array)
- Format value lists
- Tree paths or values from tree elements
- Multistep formatting
- Send accesslevel of the object
- Send value of a job parameter
- Search for values in several attributes
- Format with PHP Code (deprecated)
- Format Macros
- Load data via REST Service
- AI Value Transformation Format
- AI Value Translation Format
- Store value into a Contentserv Item
- Execute a conditional format (switch-case) Format Plugin
- Load array value from the Contentserv getValues Format Plugin
- Process HTML table Format Plugin
- Response Handler Field Plugin
- Replace via regex pattern format plugin
- Convert value ranges into each other
- Merge Array Format Plugin
- Export several attributes simultaneously
- Show all articles ( 6 ) Collapse Articles
-
GenericXML Connector
-
-
- Send value of a PIM reference
- Loop values for CS PIM references
- Send value of a Channel (view) reference
- Loop values for CS Channel (Views) references
- Send value of a MAM reference
- Loop values for CS MAM references
- Send value of an attribute reference
- Send value of a user reference
- Loop values for user references
- Send value of a reference (deprecated)
- Merge reference values format plugin
- Search for usage of item
- Search for item IDs using attribute data
-
- Loop Head and Loop Value
- Loop values for several attributes simultaneously
- Loop values for child elements
- Loop values for CS PIM references
- Loop values for CS Channel (Views) references
- Loop values for CS MAM references
- Loop values for user references
- Loop values for SC::Prices
- Loop values for SC::Stocktable entries
- Loop values for SC::Complex products
- Loop values for a CS table
- Loop values for CS type reference
- Loop value for simple data record
- Loop values for JSON Objects
- Loop for value range entries
-
- Create a JSON-String (create an array)
- Format value lists
- Tree paths or values from tree elements
- Multistep formatting
- Send accesslevel of the object
- Send value of a job parameter
- Search for values in several attributes
- Format with PHP Code (deprecated)
- Format Macros
- Load data via REST Service
- AI Value Transformation Format
- AI Value Translation Format
- Store value into a Contentserv Item
- Execute a conditional format (switch-case) Format Plugin
- Load array value from the Contentserv getValues Format Plugin
- Process HTML table Format Plugin
- Replace via regex pattern format plugin
- Convert value ranges into each other
- Merge Array Format Plugin
- Export several attributes simultaneously
- Show all articles ( 5 ) Collapse Articles
-
SimpleExcel Connector
-
-
- Send value of a PIM reference
- Loop values for CS PIM references
- Send value of a Channel (view) reference
- Loop values for CS Channel (Views) references
- Send value of a MAM reference
- Loop values for CS MAM references
- Send value of an attribute reference
- Send value of a user reference
- Loop values for user references
- Send value of a reference (deprecated)
- Merge reference values format plugin
- Search for usage of item
- Search for item IDs using attribute data
-
- Loop Head and Loop Value
- Loop values for several attributes simultaneously
- Loop values for child elements
- Loop values for CS PIM references
- Loop values for CS Channel (Views) references
- Loop values for CS MAM references
- Loop values for user references
- Loop values for SC::Prices
- Loop values for SC::Stocktable entries
- Loop values for SC::Complex products
- Loop values for a CS table
- Loop values for CS type reference
- Loop value for simple data record
- Loop values for JSON Objects
- Loop for value range entries
-
- Create a JSON-String (create an array)
- Format value lists
- Tree paths or values from tree elements
- Multistep formatting
- Send accesslevel of the object
- Send value of a job parameter
- Search for values in several attributes
- Format with PHP Code (deprecated)
- Format Macros
- Load data via REST Service
- AI Value Transformation Format
- AI Value Translation Format
- Store value into a Contentserv Item
- Execute a conditional format (switch-case) Format Plugin
- Load array value from the Contentserv getValues Format Plugin
- Process HTML table Format Plugin
- Replace via regex pattern format plugin
- Convert value ranges into each other
- Merge Array Format Plugin
- Export several attributes simultaneously
- Show all articles ( 5 ) Collapse Articles
-
Magento Connector
-
-
- Send value of a PIM reference
- Loop values for CS PIM references
- Send value of a Channel (view) reference
- Loop values for CS Channel (Views) references
- Send value of a MAM reference
- Loop values for CS MAM references
- Send value of an attribute reference
- Send value of a user reference
- Loop values for user references
- Send value of a reference (deprecated)
- Merge reference values format plugin
- Search for usage of item
- Search for item IDs using attribute data
-
- Loop Head and Loop Value
- Loop values for several attributes simultaneously
- Loop values for child elements
- Loop values for CS PIM references
- Loop values for CS Channel (Views) references
- Loop values for CS MAM references
- Loop values for user references
- Loop values for SC::Prices
- Loop values for SC::Stocktable entries
- Loop values for SC::Complex products
- Loop values for a CS table
- Loop values for CS type reference
- Loop value for simple data record
- Loop values for JSON Objects
- Loop for value range entries
-
- Create a JSON-String (create an array)
- Format value lists
- Tree paths or values from tree elements
- Multistep formatting
- Send accesslevel of the object
- Send value of a job parameter
- Search for values in several attributes
- Format with PHP Code (deprecated)
- Format Macros
- Load data via REST Service
- AI Value Transformation Format
- AI Value Translation Format
- Store value into a Contentserv Item
- Execute a conditional format (switch-case) Format Plugin
- Load array value from the Contentserv getValues Format Plugin
- Process HTML table Format Plugin
- Replace via regex pattern format plugin
- Convert value ranges into each other
- Merge Array Format Plugin
- Export several attributes simultaneously
- Show all articles ( 5 ) Collapse Articles
-
Shopware 5 Connector
-
- Configuration Shopware
- Configuration PIM
- Shopware attribute setting
- Configuration SAWSConnector
- Station configuration
- Source data set configuration
- Configuring categories and products
- Price table configuration for Shopware
- Result in Shopware
- Subshops and the SAWSConnector Shopware
- ean
- Custom Fields (attribute)
- highlight
- purchaseSteps
- stockMin
- supplierNumber
- notification
- shippingFree
- length
- height
- width
- weight
- shippingTime
- metaKeywords
- Show all articles ( 9 ) Collapse Articles
-
-
- Send value of a PIM reference
- Loop values for CS PIM references
- Send value of a Channel (view) reference
- Loop values for CS Channel (Views) references
- Send value of a MAM reference
- Loop values for CS MAM references
- Send value of an attribute reference
- Send value of a user reference
- Loop values for user references
- Send value of a reference (deprecated)
- Merge reference values format plugin
- Search for usage of item
- Search for item IDs using attribute data
-
- Loop Head and Loop Value
- Loop values for several attributes simultaneously
- Loop values for child elements
- Loop values for CS PIM references
- Loop values for CS Channel (Views) references
- Loop values for CS MAM references
- Loop values for user references
- Loop values for SC::Prices
- Loop values for SC::Stocktable entries
- Loop values for SC::Complex products
- Loop values for a CS table
- Loop values for CS type reference
- Loop value for simple data record
- Loop values for JSON Objects
- Loop for value range entries
-
- Create a JSON-String (create an array)
- Format value lists
- Tree paths or values from tree elements
- Multistep formatting
- Send accesslevel of the object
- Send value of a job parameter
- Search for values in several attributes
- Format with PHP Code (deprecated)
- Format Macros
- Load data via REST Service
- AI Value Transformation Format
- AI Value Translation Format
- Store value into a Contentserv Item
- Execute a conditional format (switch-case) Format Plugin
- Load array value from the Contentserv getValues Format Plugin
- Process HTML table Format Plugin
- Replace via regex pattern format plugin
- Convert value ranges into each other
- Merge Array Format Plugin
- Export several attributes simultaneously
- Show all articles ( 5 ) Collapse Articles
-
Shopware 6 Connector
-
- Tutorial Video
- First steps
- Import Shopware settings
- Export categories
- Export media files
- Export simple products
- Export multiple languages
- Export variant products
- Export product properties
- Export custom fields
- Export product cross-selling relationships
- Export prices
- Export stocks
- Export into any other Shopware field
- How to address multiple Shopware 6 websites
- How to address different Shopware 6 Sale-Channels from one Contentserv System
- Useful Links
- Sales Channel Maintenance via Excel Cross-Reference
- Show all articles ( 3 ) Collapse Articles
-
-
- Send value of a PIM reference
- Loop values for CS PIM references
- Send value of a MAM reference
- Loop values for CS MAM references
- Send value of a Channel (view) reference
- Loop values for CS Channel (Views) references
- Send value of an attribute reference
- Send value of a user reference
- Loop values for user references
- Send value of a reference (deprecated)
- Merge reference values format plugin
- Search for usage of item
- Search for item IDs using attribute data
-
- Loop Head and Loop Value
- Loop values for several attributes simultaneously
- Loop values for child elements
- Loop values for CS PIM references
- Loop values for CS Channel (Views) references
- Loop values for CS MAM references
- Loop values for user references
- Loop values for SC::Prices
- Loop values for SC::Stocktable entries
- Loop values for SC::Complex products
- Loop values for a CS table
- Loop values for CS type reference
- Loop value for simple data record
- Loop values for JSON Objects
- Loop for value range entries
-
- Create a JSON-String (create an array)
- Format value lists
- Tree paths or values from tree elements
- Multistep formatting
- Send accesslevel of the object
- Send value of a job parameter
- Search for values in several attributes
- Format with PHP Code (deprecated)
- Format Macros
- Load data via REST Service
- AI Value Transformation Format
- AI Value Translation Format
- Store value into a Contentserv Item
- Execute a conditional format (switch-case) Format Plugin
- Load array value from the Contentserv getValues Format Plugin
- Process HTML table Format Plugin
- Replace via regex pattern format plugin
- Convert value ranges into each other
- Merge Array Format Plugin
- Export several attributes simultaneously
- Show all articles ( 5 ) Collapse Articles
-
OXID Connector
-
-
- Send value of a PIM reference
- Loop values for CS PIM references
- Send value of a MAM reference
- Loop values for CS MAM references
- Send value of a Channel (view) reference
- Loop values for CS Channel (Views) references
- Send value of an attribute reference
- Send value of a user reference
- Loop values for user references
- Send value of a reference (deprecated)
- Merge reference values format plugin
- Search for usage of item
- Search for item IDs using attribute data
-
- Loop Head and Loop Value
- Loop values for several attributes simultaneously
- Loop values for child elements
- Loop values for CS PIM references
- Loop values for CS Channel (Views) references
- Loop values for CS MAM references
- Loop values for user references
- Loop values for SC::Prices
- Loop values for SC::Stocktable entries
- Loop values for SC::Complex products
- Loop values for a CS table
- Loop values for CS type reference
- Loop value for simple data record
- Loop values for JSON Objects
- Loop for value range entries
-
- Create a JSON-String (create an array)
- Format value lists
- Tree paths or values from tree elements
- Multistep formatting
- Send accesslevel of the object
- Send value of a job parameter
- Search for values in several attributes
- Format with PHP Code (deprecated)
- Format Macros
- Load data via REST Service
- AI Value Transformation Format
- AI Value Translation Format
- Store value into a Contentserv Item
- Execute a conditional format (switch-case) Format Plugin
- Load array value from the Contentserv getValues Format Plugin
- Process HTML table Format Plugin
- Replace via regex pattern format plugin
- Convert value ranges into each other
- Merge Array Format Plugin
- Export several attributes simultaneously
- Show all articles ( 5 ) Collapse Articles
-
Typo3 Connector
-
-
- Send value of a PIM reference
- Loop values for CS PIM references
- Send value of a Channel (view) reference
- Loop values for CS Channel (Views) references
- Send value of a MAM reference
- Loop values for CS MAM references
- Send value of an attribute reference
- Send value of a user reference
- Loop values for user references
- Send value of a reference (deprecated)
- Merge reference values format plugin
- Search for usage of item
- Search for item IDs using attribute data
-
- Loop Head and Loop Value
- Loop values for several attributes simultaneously
- Loop values for child elements
- Loop values for CS PIM references
- Loop values for CS Channel (Views) references
- Loop values for CS MAM references
- Loop values for user references
- Loop values for SC::Prices
- Loop values for SC::Stocktable entries
- Loop values for SC::Complex products
- Loop values for a CS table
- Loop values for CS type reference
- Loop value for simple data record
- Loop values for JSON Objects
- Loop for value range entries
-
- Create a JSON-String (create an array)
- Format value lists
- Tree paths or values from tree elements
- Multistep formatting
- Send accesslevel of the object
- Send value of a job parameter
- Search for values in several attributes
- Format with PHP Code (deprecated)
- Format Macros
- Load data via REST Service
- AI Value Transformation Format
- AI Value Translation Format
- Store value into a Contentserv Item
- Execute a conditional format (switch-case) Format Plugin
- Load array value from the Contentserv getValues Format Plugin
- Process HTML table Format Plugin
- Replace via regex pattern format plugin
- Convert value ranges into each other
- Merge Array Format Plugin
- Export several attributes simultaneously
- Show all articles ( 5 ) Collapse Articles
-
Other Connectors
Logbook
The Logbook is a feature for your Stations, Datamaps, or Jobs. As the name suggests, it allows you to create log entries for the area. This can be extremely useful for keeping track of who made changes, what changes were made, and when they occurred. An important note: entries are not generated automatically; they must be created manually by a user.
A more detailed explanation will follow later in this article.
How to Access the Logbook:
Firstly, it is important to note that when you open a Station, you will see all log entries that are either directly linked to the Station itself or to any of its Datamaps or Jobs. When accessing the Logbook from within a Datamap, only log entries directly linked to that specific Datamap will be displayed. The same behavior applies when accessing the Logbook from a Job.
How to Open the Logbook for a Station:
Click on the Station for which you want to access the Logbook. After opening the Station, click the Logbook icon in the top right corner.
How to Open the Logbook for a Datamap:
To open the Logbook for a Datamap, you can either click Datamaps in the top navigation bar and select the Datamap for which you want to access the Logbook, or click the Pipeline in the bottom left corner and select a Datamap. If you choose this method, you will be required to select a Job context.
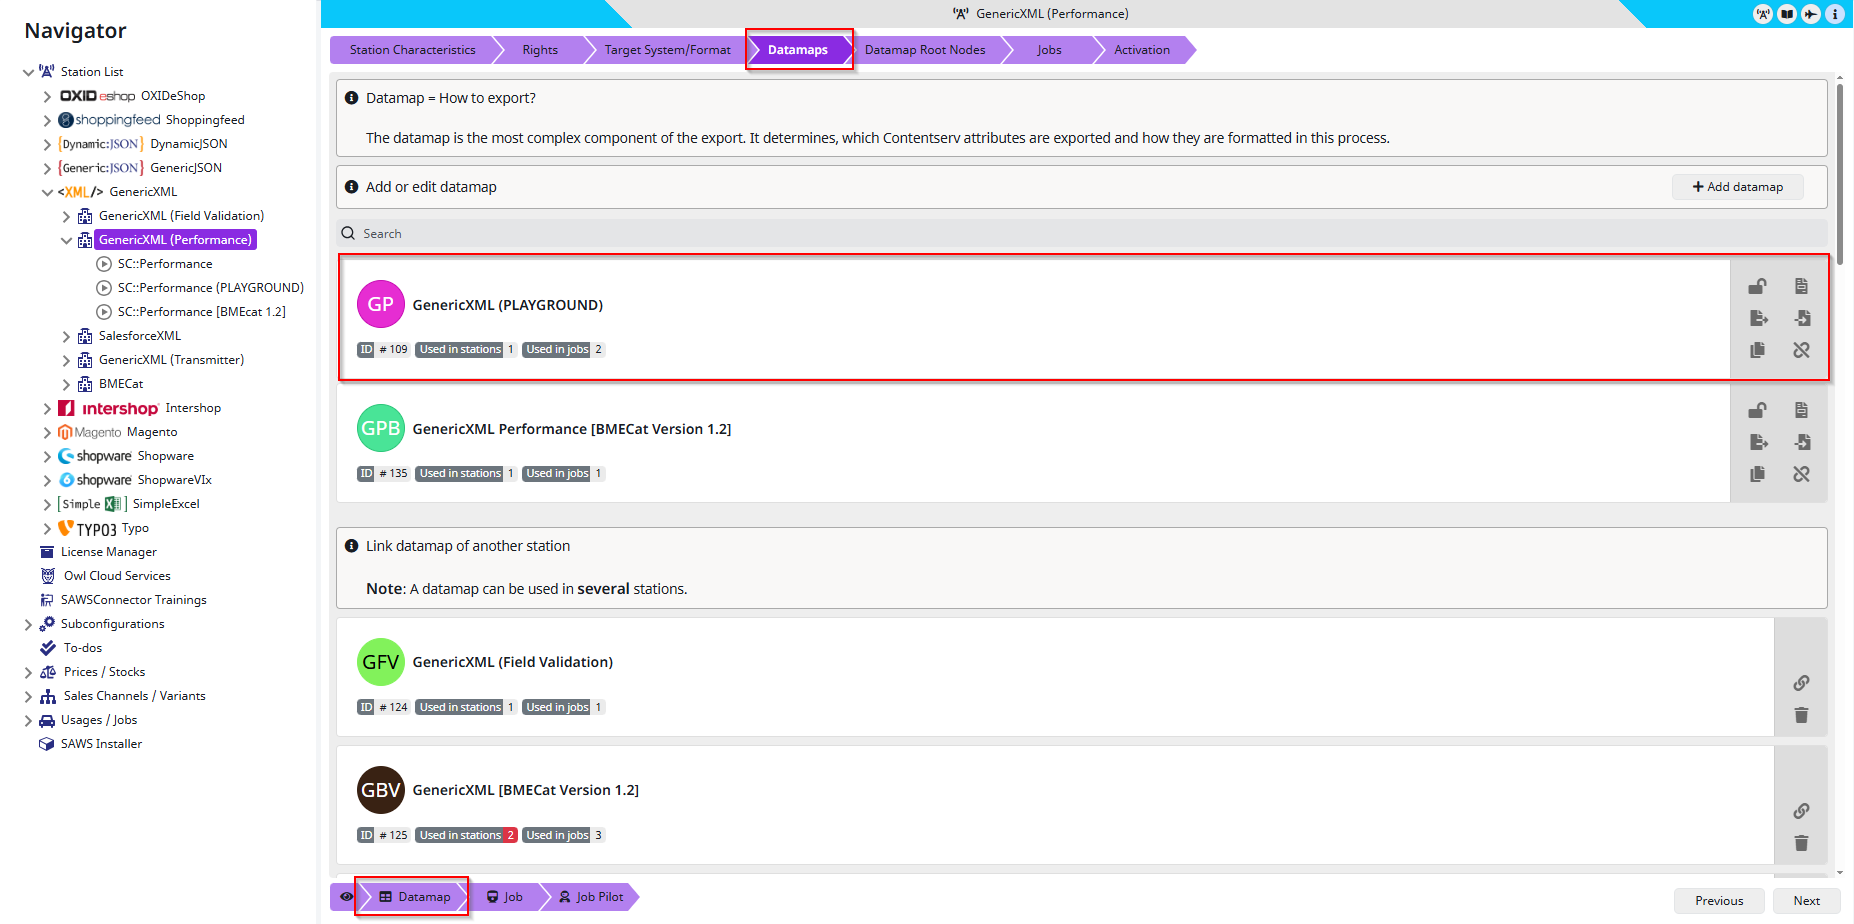
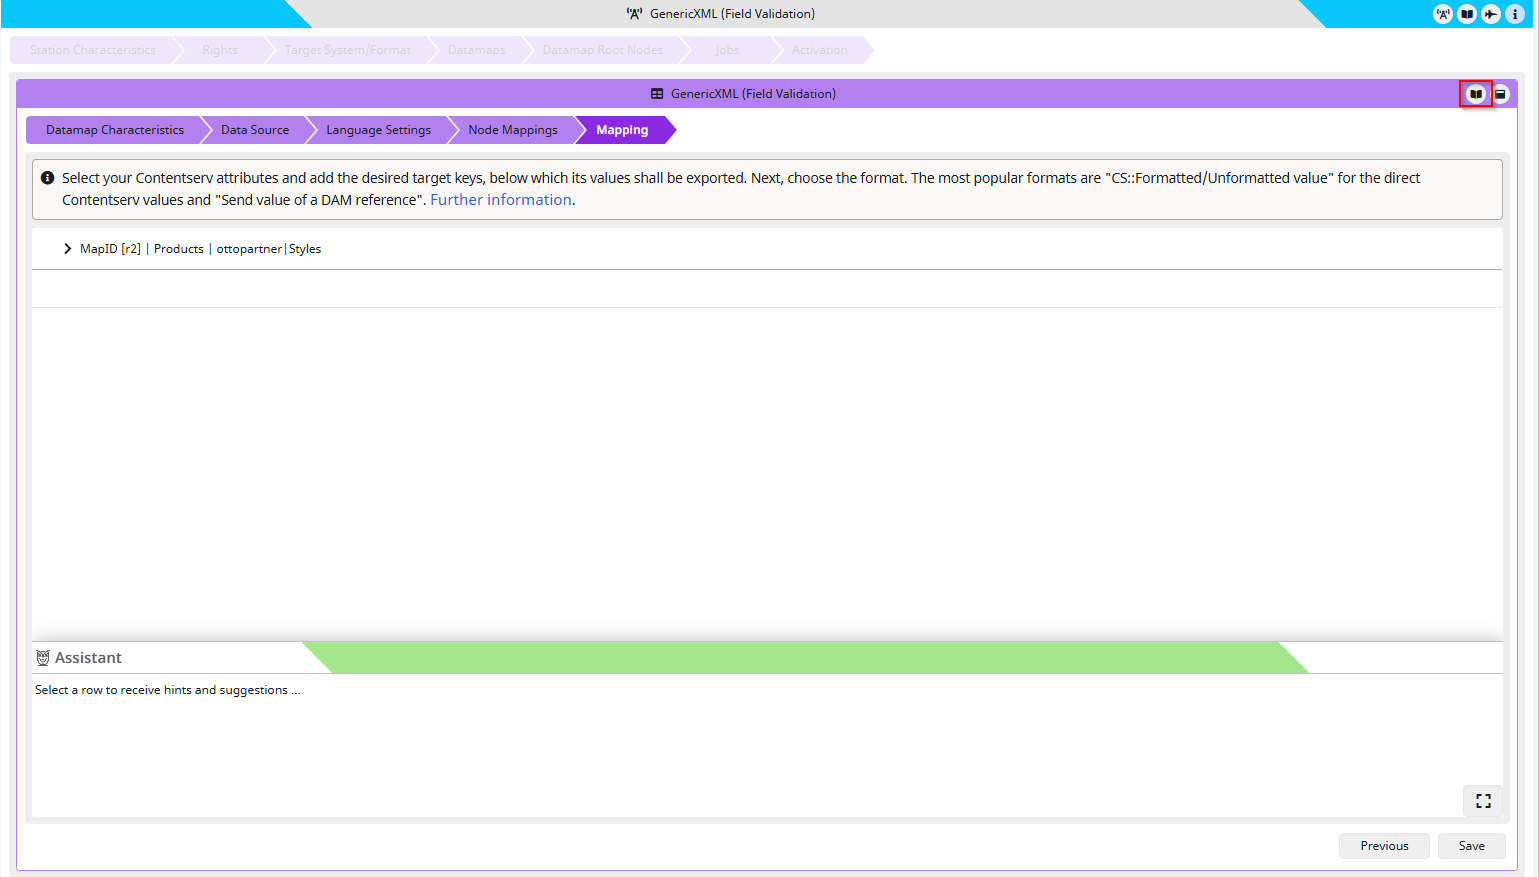
If you choose to click the Datamaps tab in the top navigation bar and then select a Datamap, you will see the Datamap view. To open the Logbook for the selected Datamap, click the Logbook icon in the top right corner.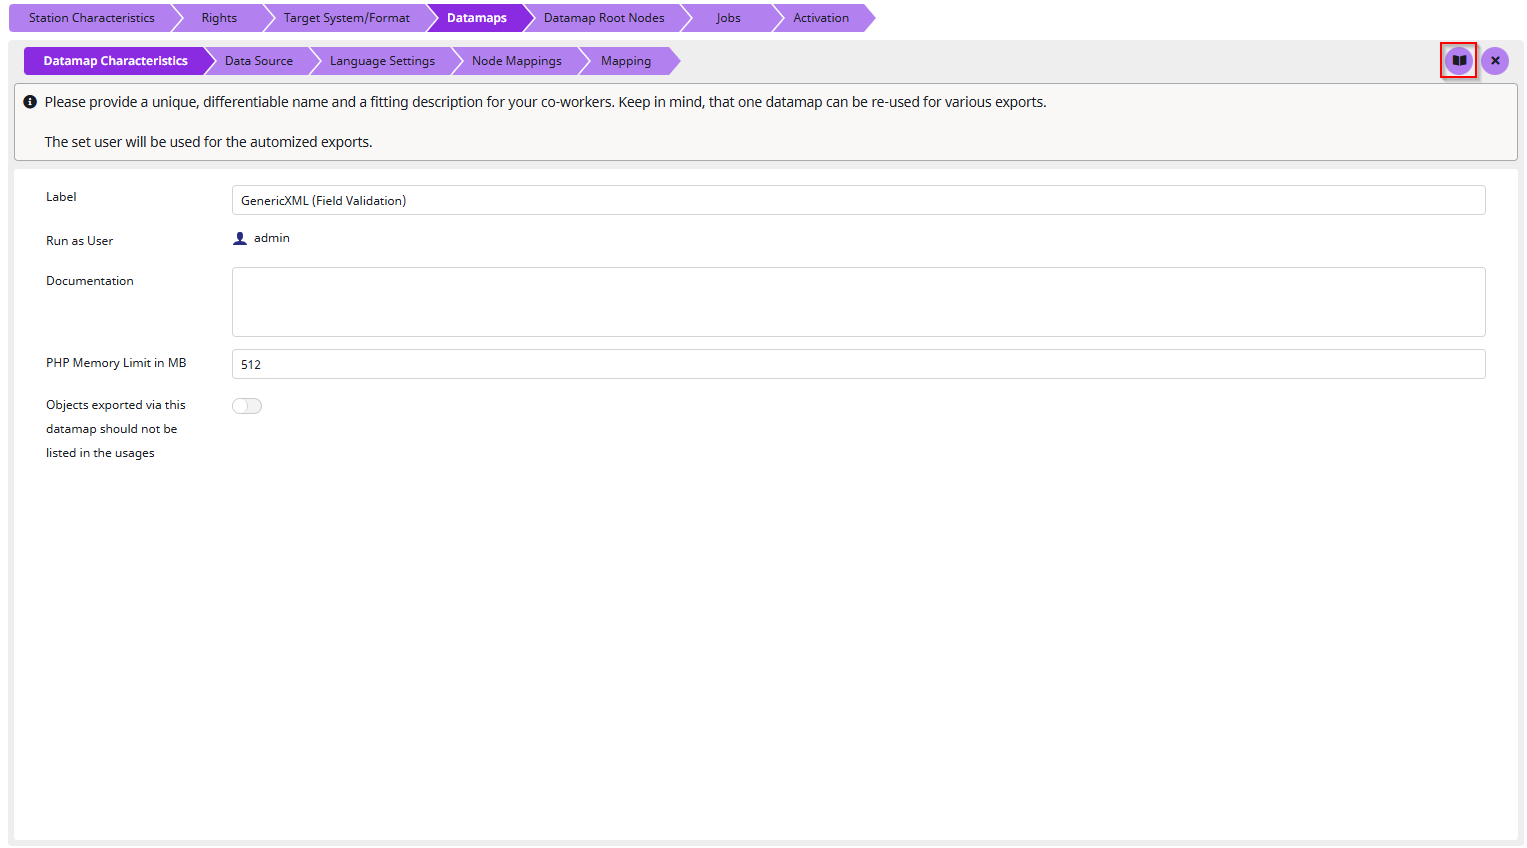
If you choose to select a Datamap from the bottom Pipeline, you must first select your Job context. After that, you can open the Logbook in the same way as the other method by clicking the Logbook icon in the top right corner, as shown in the screenshot.
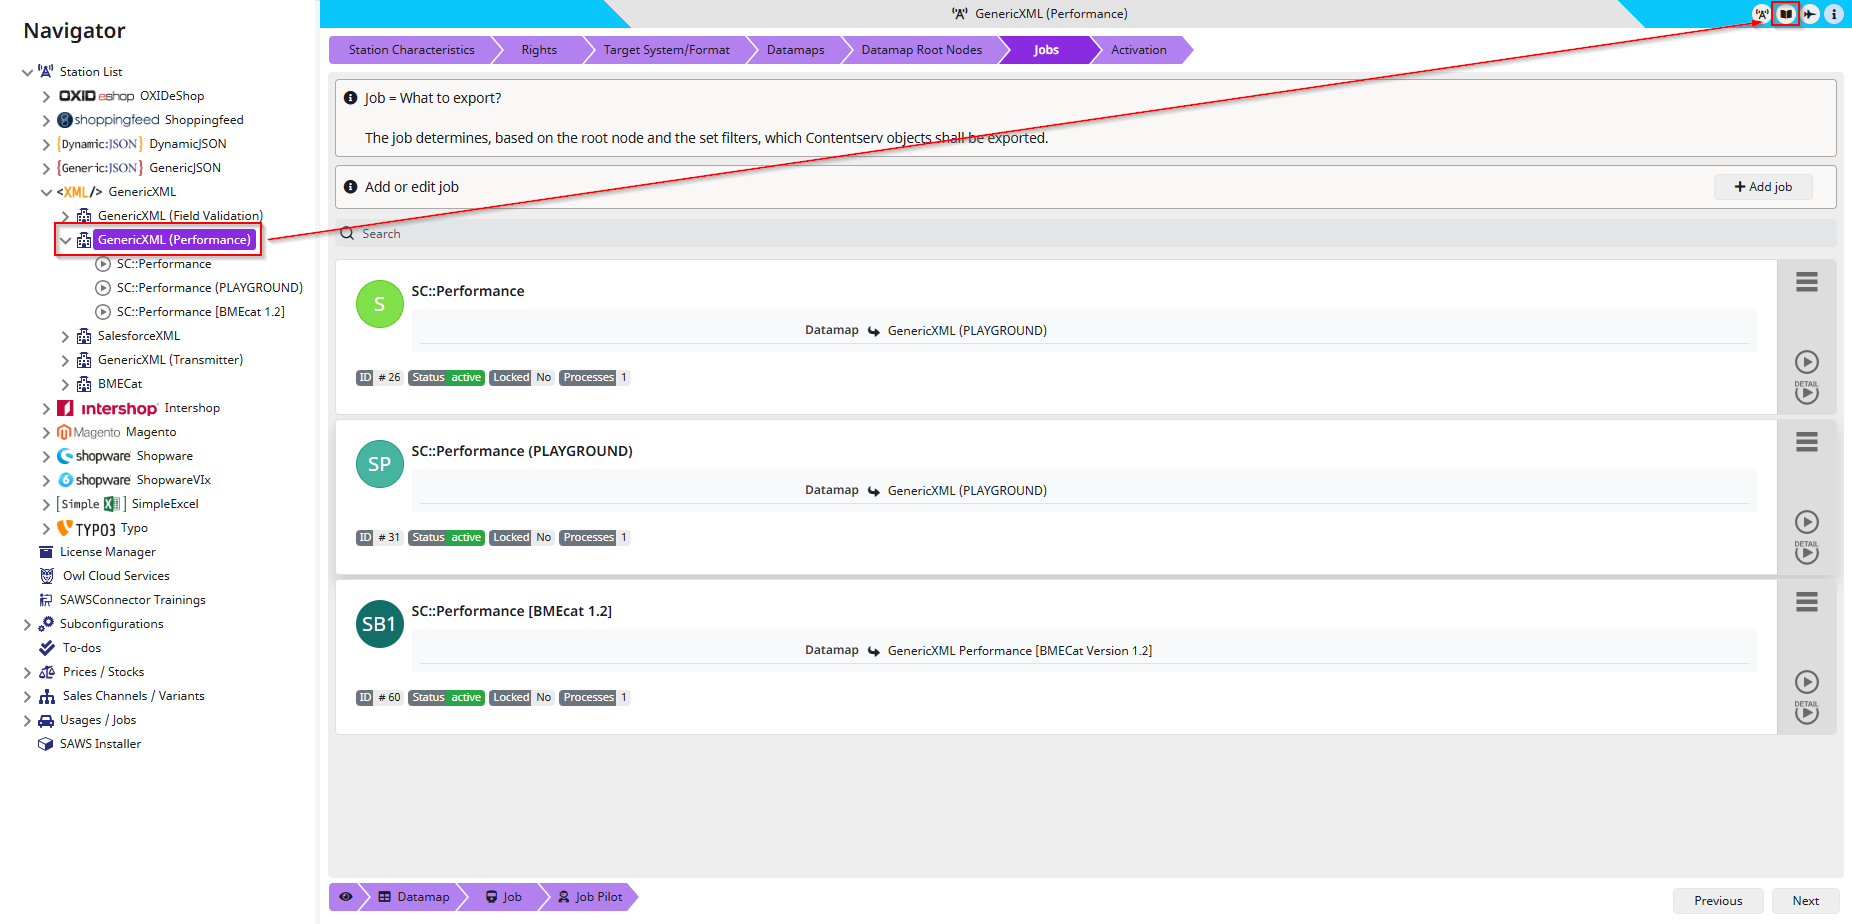
How to Open the Logbook for a Job:
To open the Logbook for a Job, you can either click Jobs in the top navigation bar and select the Job for which you want to access the Logbook, or click the Pipeline in the bottom left corner and select a Job. If you choose this method, you will be required to select a Job context.
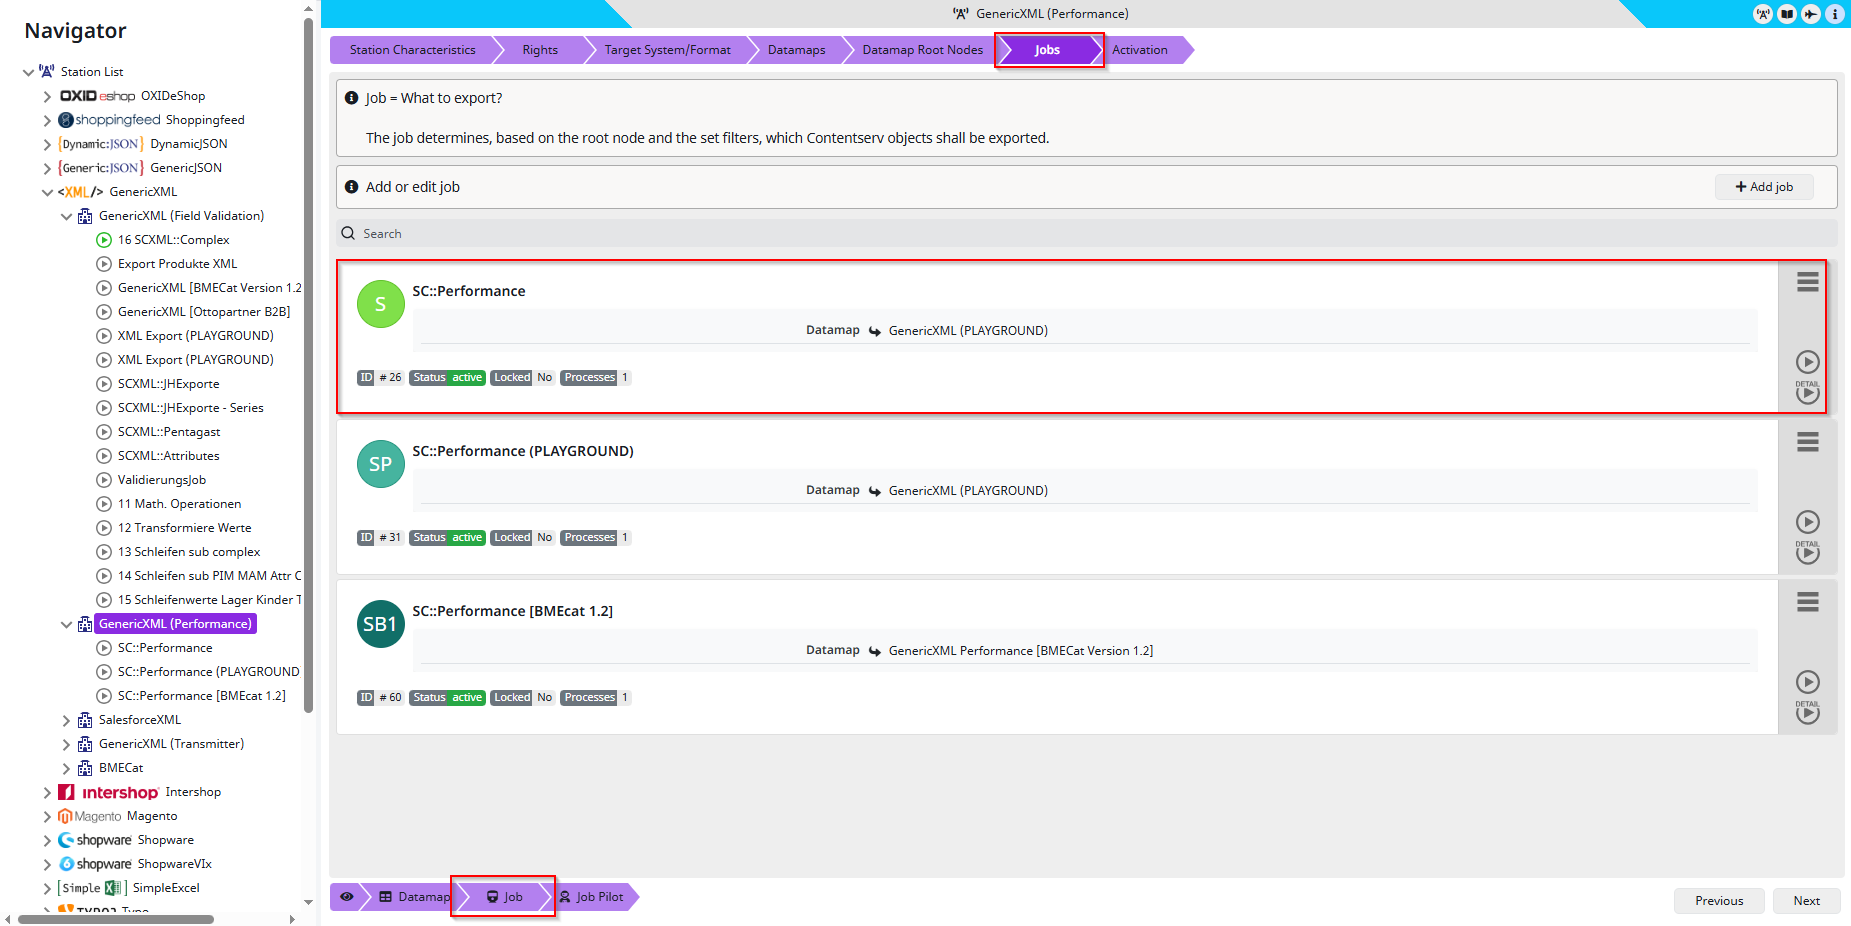
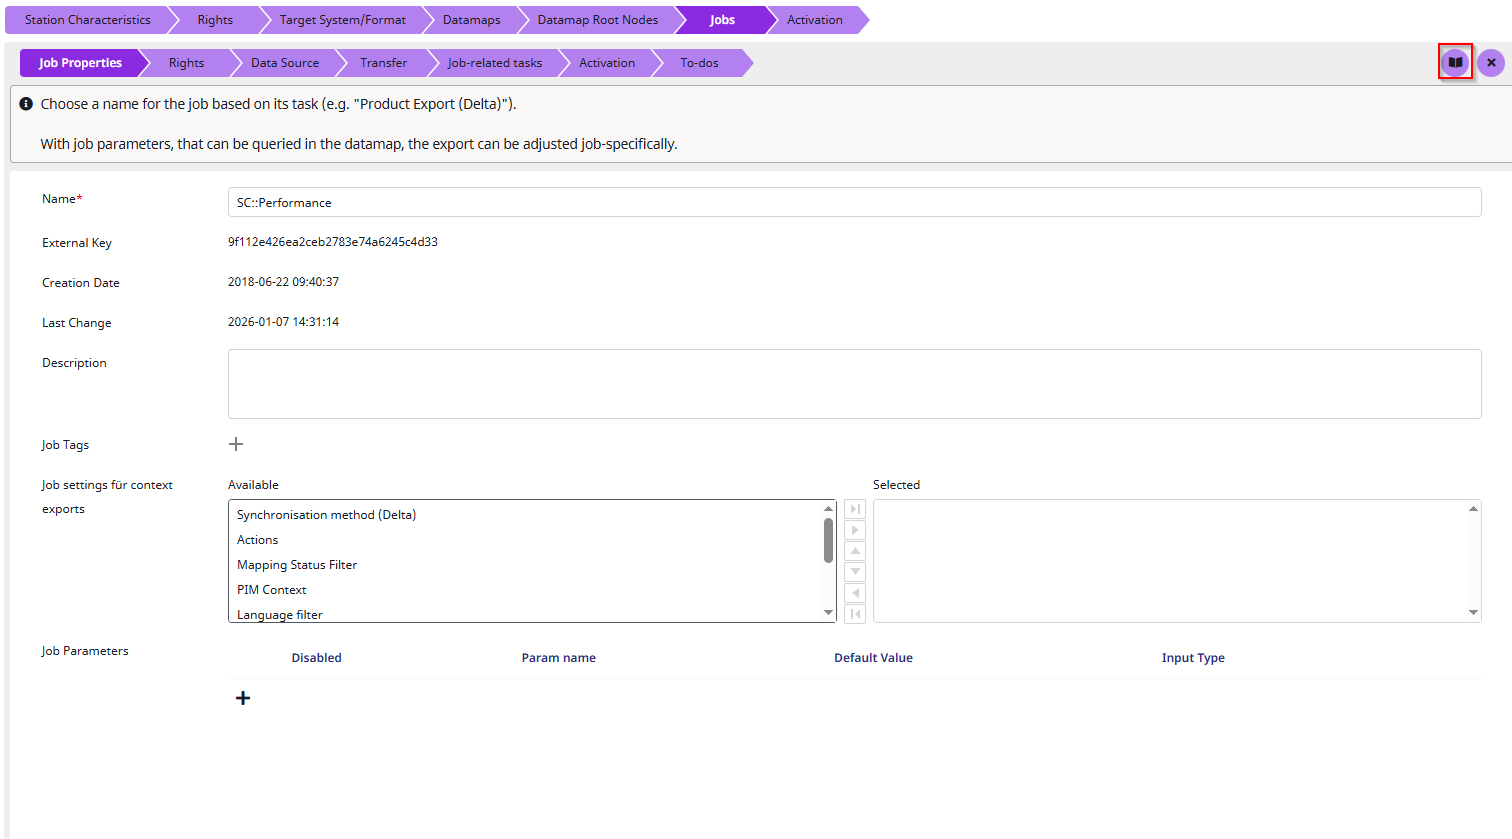
If you choose to click the Jobs tab in the top navigation bar and then select a Job, you will see the Job view. To open the Logbook for the selected Job, click the Logbook icon in the top right corner.
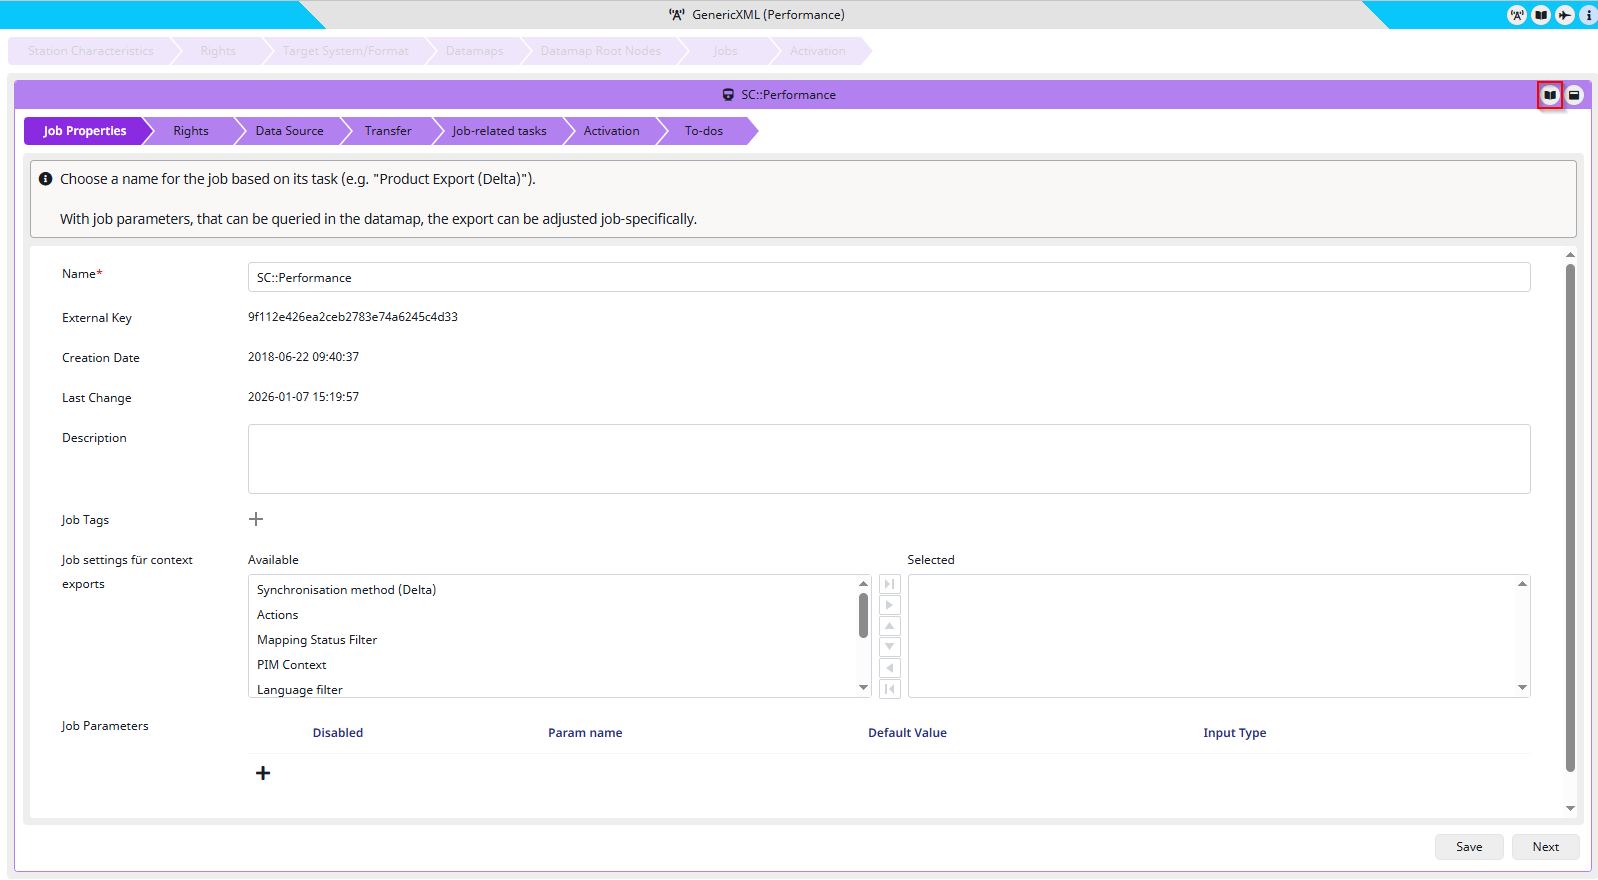
If you choose to select a Job from the bottom Pipeline, you must first select your Job context. After that, you can open the Logbook in the same way as the other method by clicking the Logbook icon in the top right corner, as shown in the screenshot.
How to Navigate the Logbook:
After accessing the Logbook for your selected Station, Datamap, or Job, a new window the Logbook Window will open. The window will appear similar to the screenshot below. The following sections will explain how to use the Logbook.
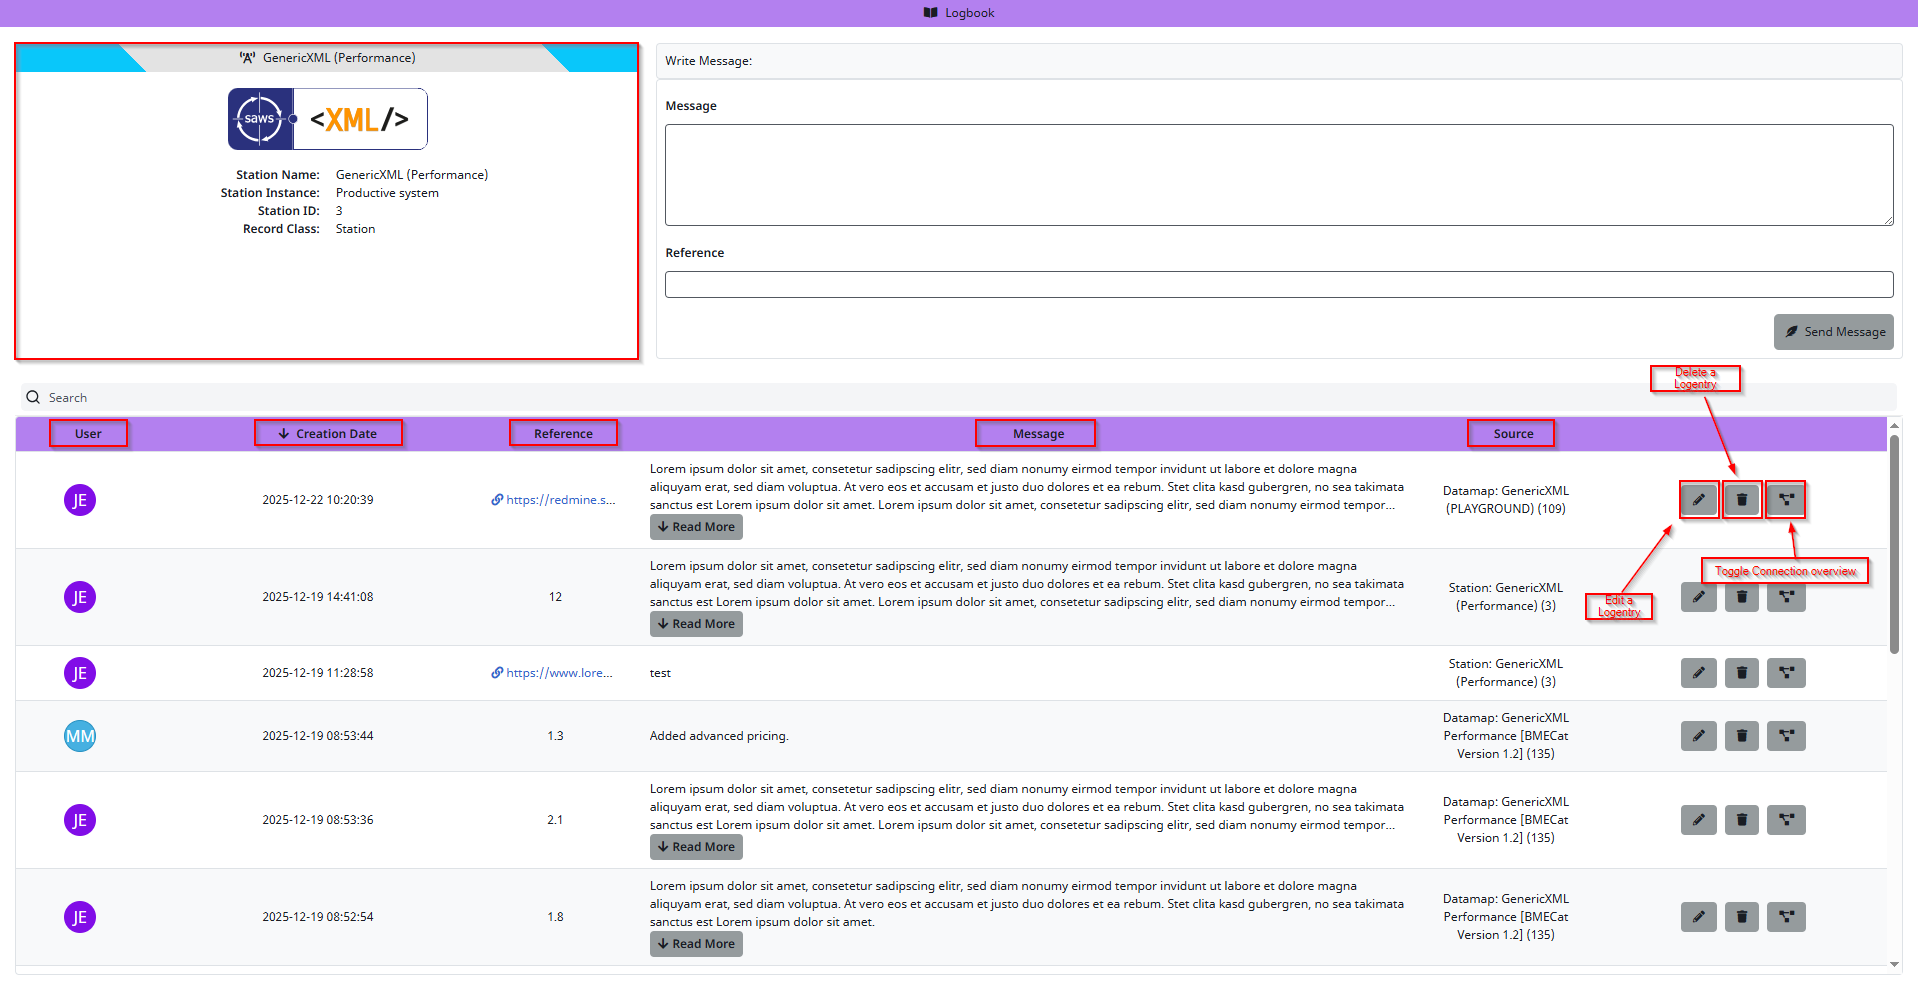
To create a new entry, simply enter a message and, optionally, a reference, then click the Send Message button.
Logbook UI Overview:
Station Info:
In the top left corner, information about the selected Station, Datamap, or Job is displayed. In this example, a Station is selected.
Search Bar:
The search bar allows you to search across all log entries. Your input will be matched against messages, users, creation dates, and references. This makes it easy to quickly locate specific entries.
User:
This column shows the user who last interacted with the entry. For example, if you edit someone else’s log entry, the user will update to your account. Clicking the User header (as marked in the screenshot) allows you to sort the log entries by user.
Creation Date:
This column displays the date the entry was created. You can also filter by this column, which is the default sorting option.
Reference:
The Reference column can be used to link entries to external systems, such as tickets or versioning systems. This field is optional and can be left blank if not needed.
Message:
This column contains the log entry message. It should describe the change or action performed and provide context for other users.
Source:
The Source column shows where the log entry originated. For example, if you open the Logbook from a Station, some entries may come directly from the Station, while others may come from connected Datamaps.
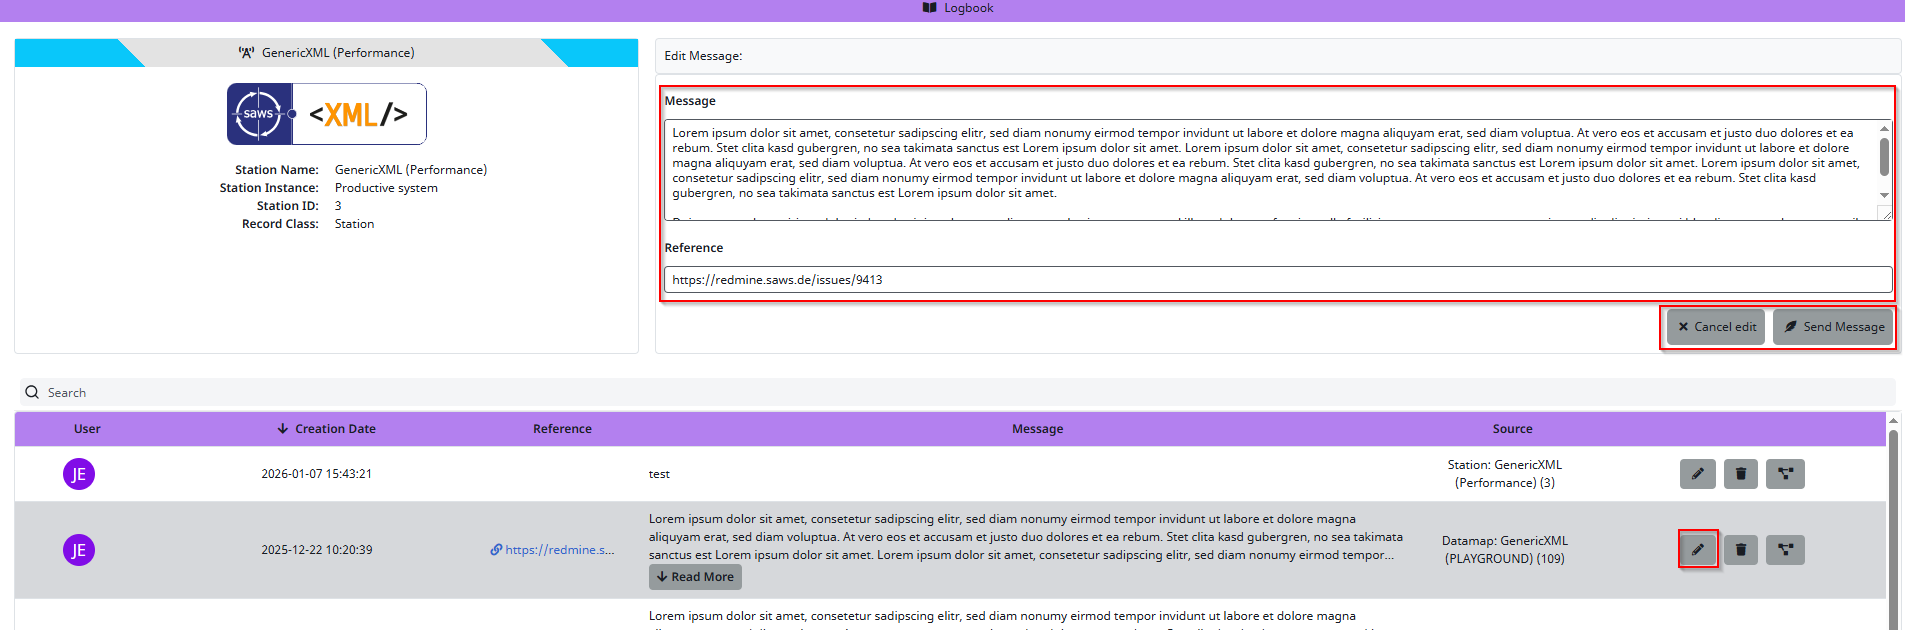
Edit Button:
The edit button is represented by a pencil icon. Clicking it allows you to edit the message in the editor located at the top right corner of the window.
-
To save your changes, click the Send button.
-
To cancel editing, click the Cancel button or select the edit button of another entry.
-
Always ensure you press Send to save any changes before switching to another entry.
Delete Button:
The Delete button removes the selected log entry. Its function is straightforward and permanent, so use it with caution.
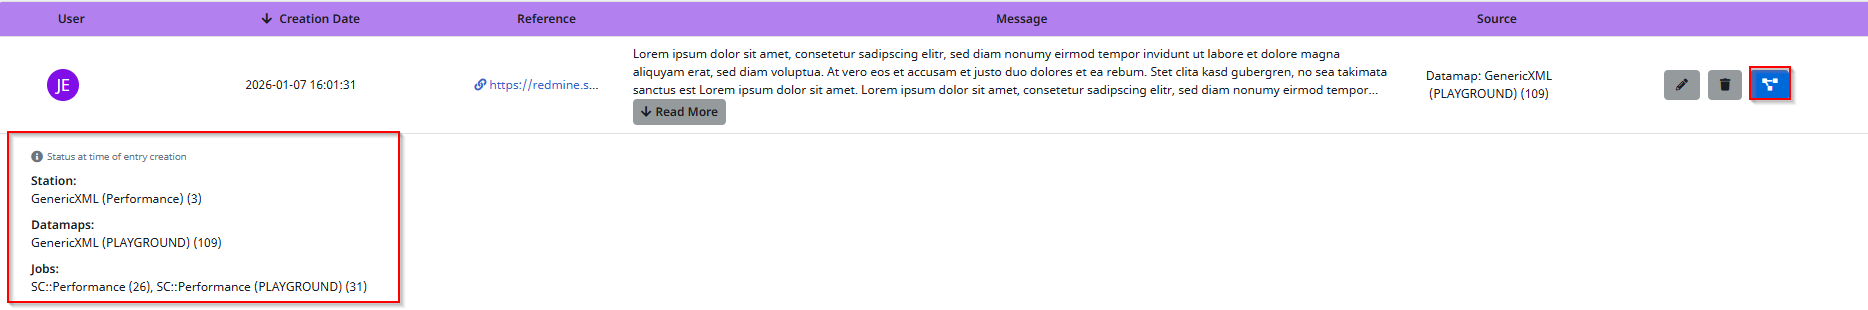
Usage Button:
The Usage feature allows you to see where the source such as a Datamap is used. For example, in the screenshot, you can view which Jobs or other elements are linked to this Datamap. This button acts as a toggle; click it again to close the usage overview. The usage overview reflects the context at the time the entry was created. It cannot be modified or updated retrospectively.